Azure DevOps Dashboards | Datadog

Create Real-Time Azure DevOps Dashboards

Monitor Azure DevOps workflows and pipelines in interactive dashboards alongside other technologies from your stack.

dg/monitor-azure-devops-dashboard

Loved & Trusted by Thousands

Washington Post logo 21st Century Fox Home Entertainment logo Peloton logo Samsung logo Comcast logo Nginx logo

Product Benefits

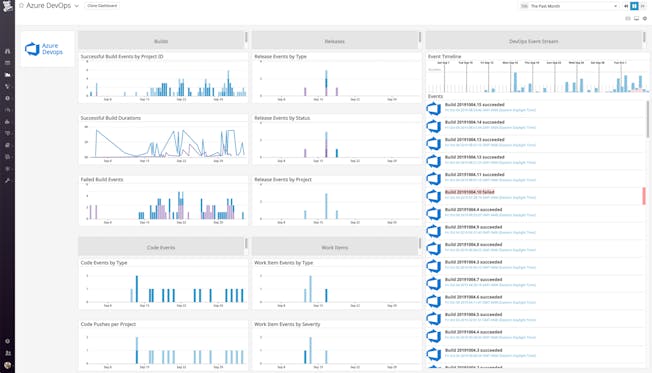
Track Azure DevOps Builds, Releases, and More in Real Time

  • Monitor your Azure DevOps workflows in interactive dashboards alongside metrics and events from other technologies in your stack
  • Gain key insights from build and release events by correlating deployments or other events with application performance data on real-time dashboards
  • Quickly pivot from problems spotted in your Azure DevOps dashboards to metrics, traces, and logs from related services without losing context
dg/monitor-azure-devops-dashboard.png

Create or Adjust Your Azure DevOps Dashboards in Seconds

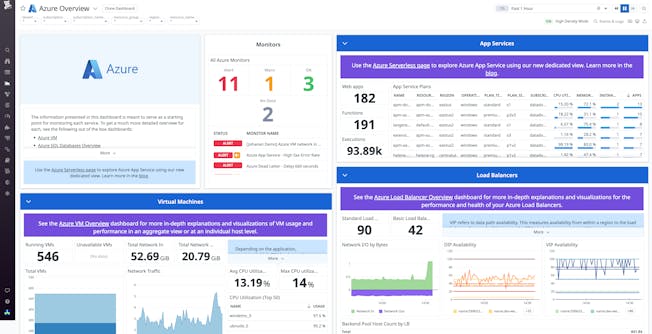
  • Start monitoring your Azure ecosystem immediately with Datadog's prebuilt dashboards for 60+ Azure services, including Azure DevOps
  • Track key metrics from Azure DevOps events without setup, such as average build time across team sprints and number of abandoned releases; ensure teams are collaborating effectively
  • Modify dashboards to include data from related Azure services or other infrastructure components in just a few clicks - no coding required

Simplify Your Onboarding Experience

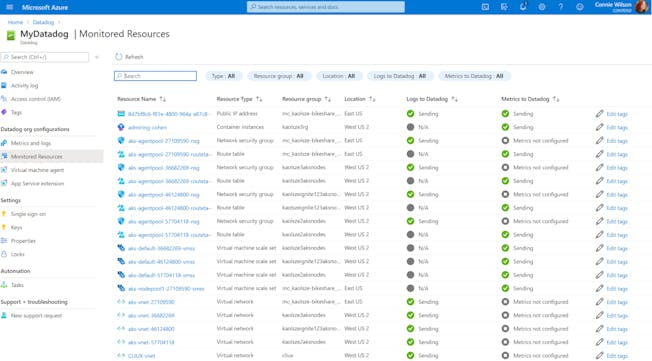
  • Simply configure the setup process by enabling single sign-on with Azure Active Directory when you create a new Datadog account
  • Easily install the Datadog Agent on multiple Azure hosts at once
  • Automatically start sending Azure platform logs and metrics to Datadog within minutes of signing up
monitored-resources-table.png

Easily Customize Visualizations to Fit Your Team's Needs

  • Track critical KPIs, SLOs, and SLAs using dashboard widgets; correlate SLO performance with specific metric spikes or dips
  • Analyze alerts for your SLIs within dashboards for faster troubleshooting and to prevent downtime
  • Choose from a multitude of different visualization types, including geomap graphs, heatmaps, stacked graphs, toplists, and more

Attain Immediate, Actionable Insights

  • Visualize anomalous behavior throughout your system in one click with Metric Correlations
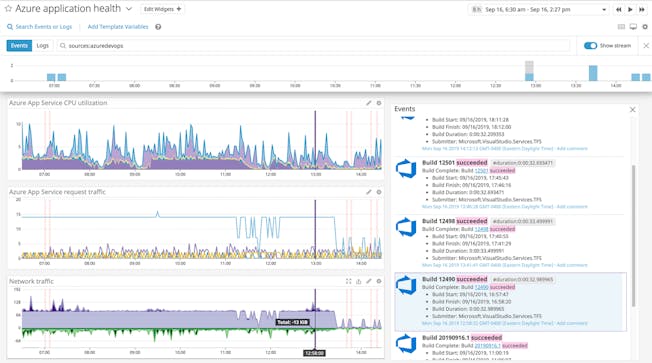
  • Test hypothesis in seconds by overlaying events onto time-synchronized graphs
  • Automatically surface issues within your infrastructure and applications; diagnose root causes faster with machine-learning features such as Watchdog, forecasting, and Metric Correlations

Improve the Speed and Agility of DevOps Initiatives

  • Understand how deployments impact application performance; track Azure DevOps builds, releases, work items, and code events with end-to-end visibility
  • Proactively prevent performance problems from occurring in production with the ability to abandon Azure DevOps deployments automatically when issues are detected
  • Monitor your CI/CD pipelines throughout the entire deployment process, in real time
dg/monitor-azure-devops-request-traffic-drops-devops-build-2.jpg

Ensure a Successful Migration with Microsoft’s Cloud Adoption Framework

  • Datadog provides critical visibility into your environment at each of the phases recommended in the Microsoft Cloud Adoption Framework
  • Ensure your environment is ready to move to the cloud and safely migrate your workloads
  • Better plan and track your migration’s progress and immediately identify problems with Datadog - a single source of truth
dg/azure-dashboard-2023.png

900+ Turn-Key Integrations, Including

The Essential Monitoring and Security Platform for the Cloud Age

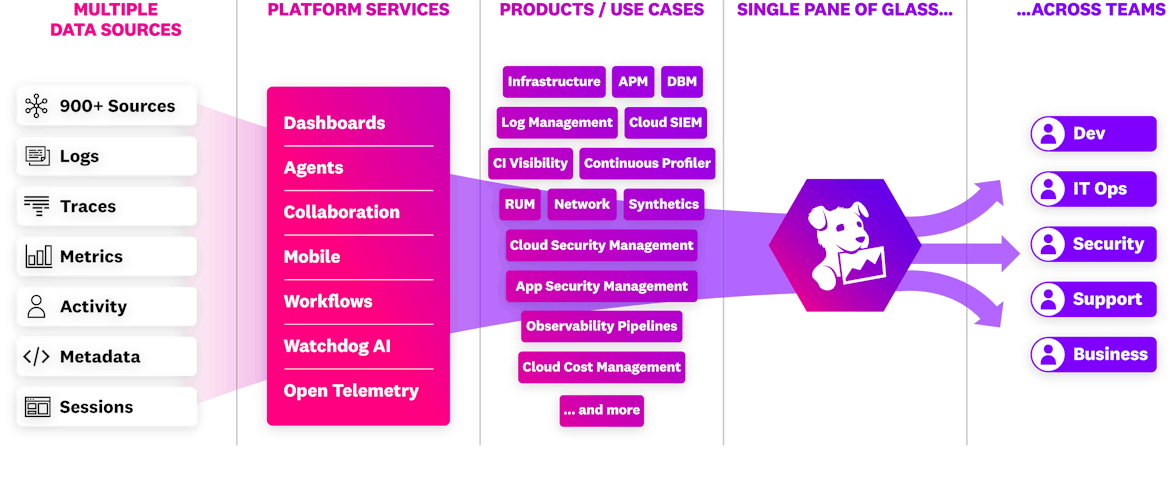
Datadog brings together end-to-end traces, metrics, and logs to make your applications, infrastructure, and third-party services entirely observable.

Platform Diagram