Datadog AKS Monitoring | Datadog

Azure Kubernetes Service Monitoring

Gain complete visibility into your AKS infrastructure with metrics, traces, and logs from Azure, Kubernetes, Docker, and every other service supporting your containerized environment.

750+ Turn-Key Integrations, Including

Product Benefits

Visualize Kubernetes Cluster Health and Performance Out-of-the-Box

  • Within minutes of installing Datadog’s Azure integration, get full visibility into your clusters’ health and performance at cluster, node, and pod levels
  • Keep tabs on your containerized workloads and visualize trends anywhere in your AKS clusters
  • Monitor and alert on important AKS resource utilization metrics like CPU, memory, and storage usage, as well as cluster health information like pod phase and state

Manage High-Scale K8s Environments with Confidence

  • Enable low impact monitoring of 10,000+ nodes with the cluster agent
  • Optimize horizontal auto-scaling by connecting Datadog to your HPA and collecting request rate, latency, and available network bandwidth
  • Gain visibility into container orchestration and easily manage Kubernetes pods over or under-allocating available resources via the real-time live container view and auto-generated container map
  • Improve operational costs and reduce excess capacity based on high-granularity historical data

Quickly Troubleshoot Container Orchestration Issues

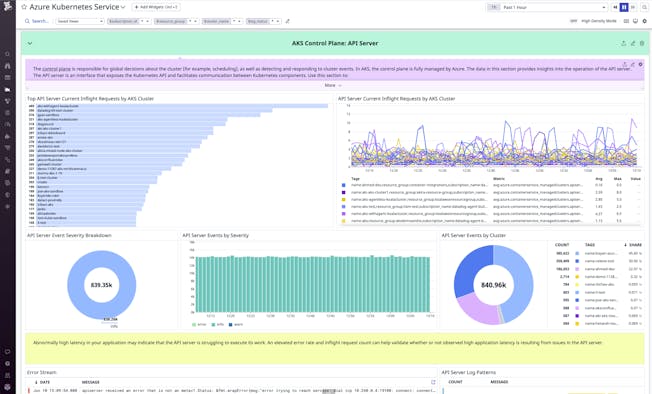
  • Visualize control plane data from your API server to get valuable insights into your AKS cluster’s orchestration layer
  • Get alerted on elevated error rates in API server logs and seamlessly correlate with rising inflight request counts to measure latency
  • Diagnose potential AKS workload issues such as spikes in the number of failed schedule attempts
blog/azure-kubernetes-service-cluster-visibility-with-aks-dashboard/aks-dash-api-server.png

Eliminate False-Positives and Receive Alerts for Only the Issues that Matter

  • Set up threshold and rate of change alerts for service-level metrics that won’t panic as containers scale down
  • Create smarter alerts that account for daily, weekly, and seasonal fluctuations
  • Proactively prevent outages and errors by forecasting system-level metrics
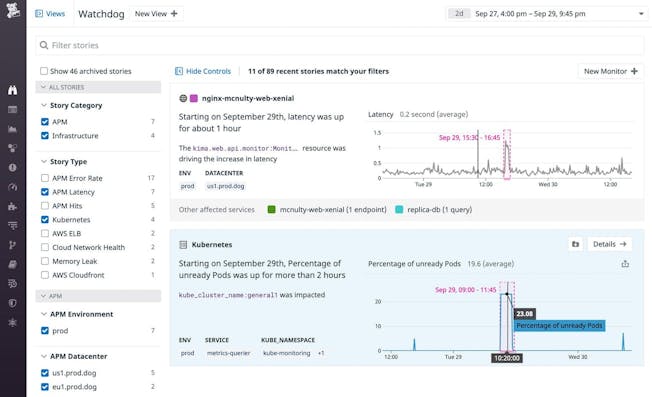
  • Automatically detect unanticipated outliers, anomalies, and errors with Watchdog
dg/datadog-watchdog-story.jpeg

Enhance Visibility with Datadog

  • Monitor your full stack in one place and create custom, drag-and-drop, real-time dashboards within seconds
  • Seamlessly navigate between your logs, infrastructure metrics, and application traces
  • Quickly deploy the agent across your entire cluster through our helm chart or daemonset
  • Automatically detect services running in Kubernetes clusters and monitor them no matter where they spin up

Track Changes in Your Containerized Infrastructure

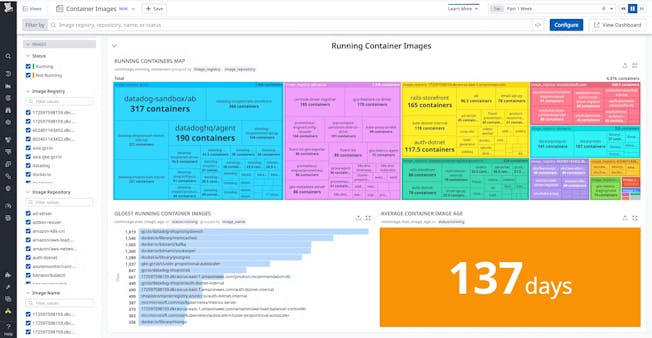
  • Gain key insights into every container image used in your environment—and about your entire container image ecosystem
  • Understand large-scale trends in security posture and resource utilization with image-specific metric dashboards
  • Reduce costs by spotting cloud registries that you may be paying for but not actively using, as well as images that are taking up unnecessary disk space in your hosts
dg/container-image-trends-image-2.png

Ensure a Successful Migration with Microsoft’s Cloud Adoption Framework

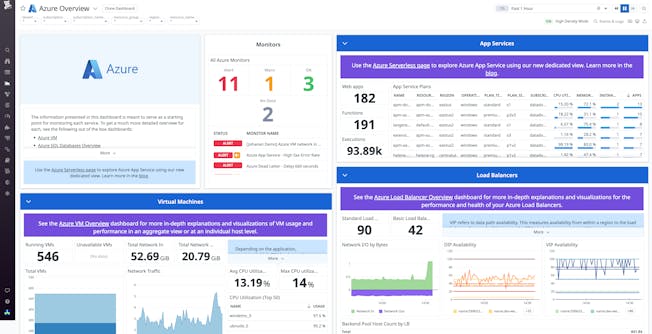
  • Datadog provides critical visibility into your environment at each of the phases recommended in the Microsoft Cloud Adoption Framework
  • Ensure your environment is ready to move to the cloud and safely migrate your workloads
  • Better plan and track your migration’s progress and immediately identify problems with Datadog - a single source of truth
dg/azure-dashboard-2023.png

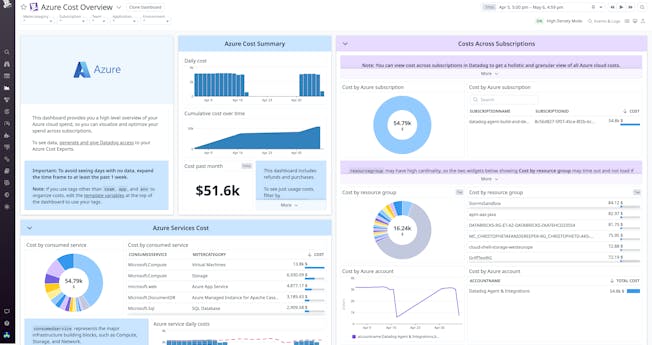
Take Control of Your Cloud Costs on Azure

  • Migrate to the cloud without any unexpected cost overages using granular, accurate Azure cost data across multiple billing accounts and subscriptions
  • Provide each team with cost data scoped to their services and applications to help empower engineers to take action
  • Identify cost optimization opportunities with unit economics and combine cost data with telemetry to visualize the full story
dg/azureccm2.png

Real results from Datadog customers

12B Log events each day, managed cost-effectively
EA DICE
<2 min Mean time to resolution (MTTR)
CITIZENS BANK
50% Cost savings on cloud resources
TRAVELSUPERMARKET

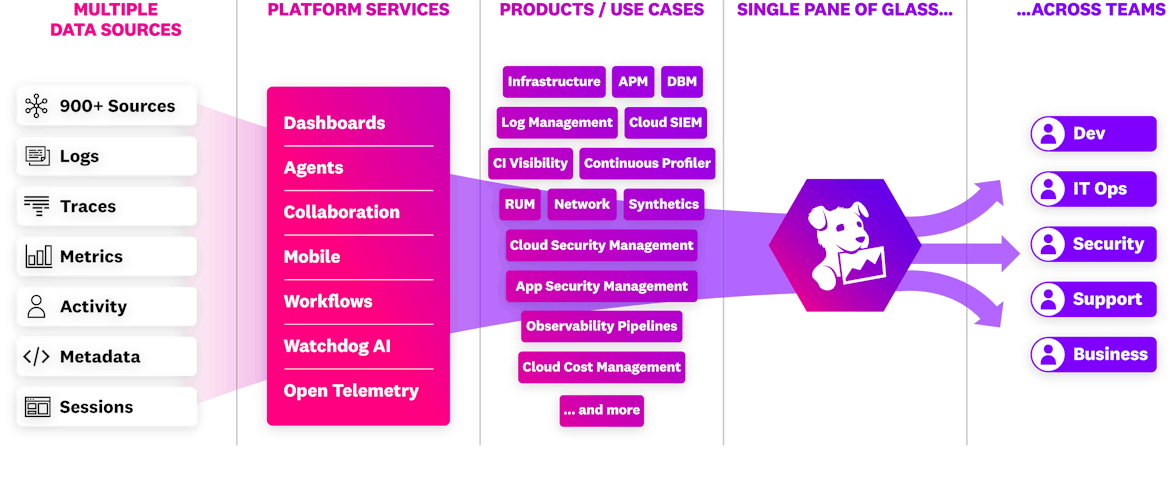
The Essential Monitoring and Security Platform for the Cloud Age

Datadog brings together end-to-end traces, metrics, and logs to make your applications, infrastructure, and third-party services entirely observable.

Platform Diagram

Loved & Trusted by Thousands

Washington Post logo 21st Century Fox Home Entertainment logo Peloton logo Samsung logo Comcast logo Nginx logo