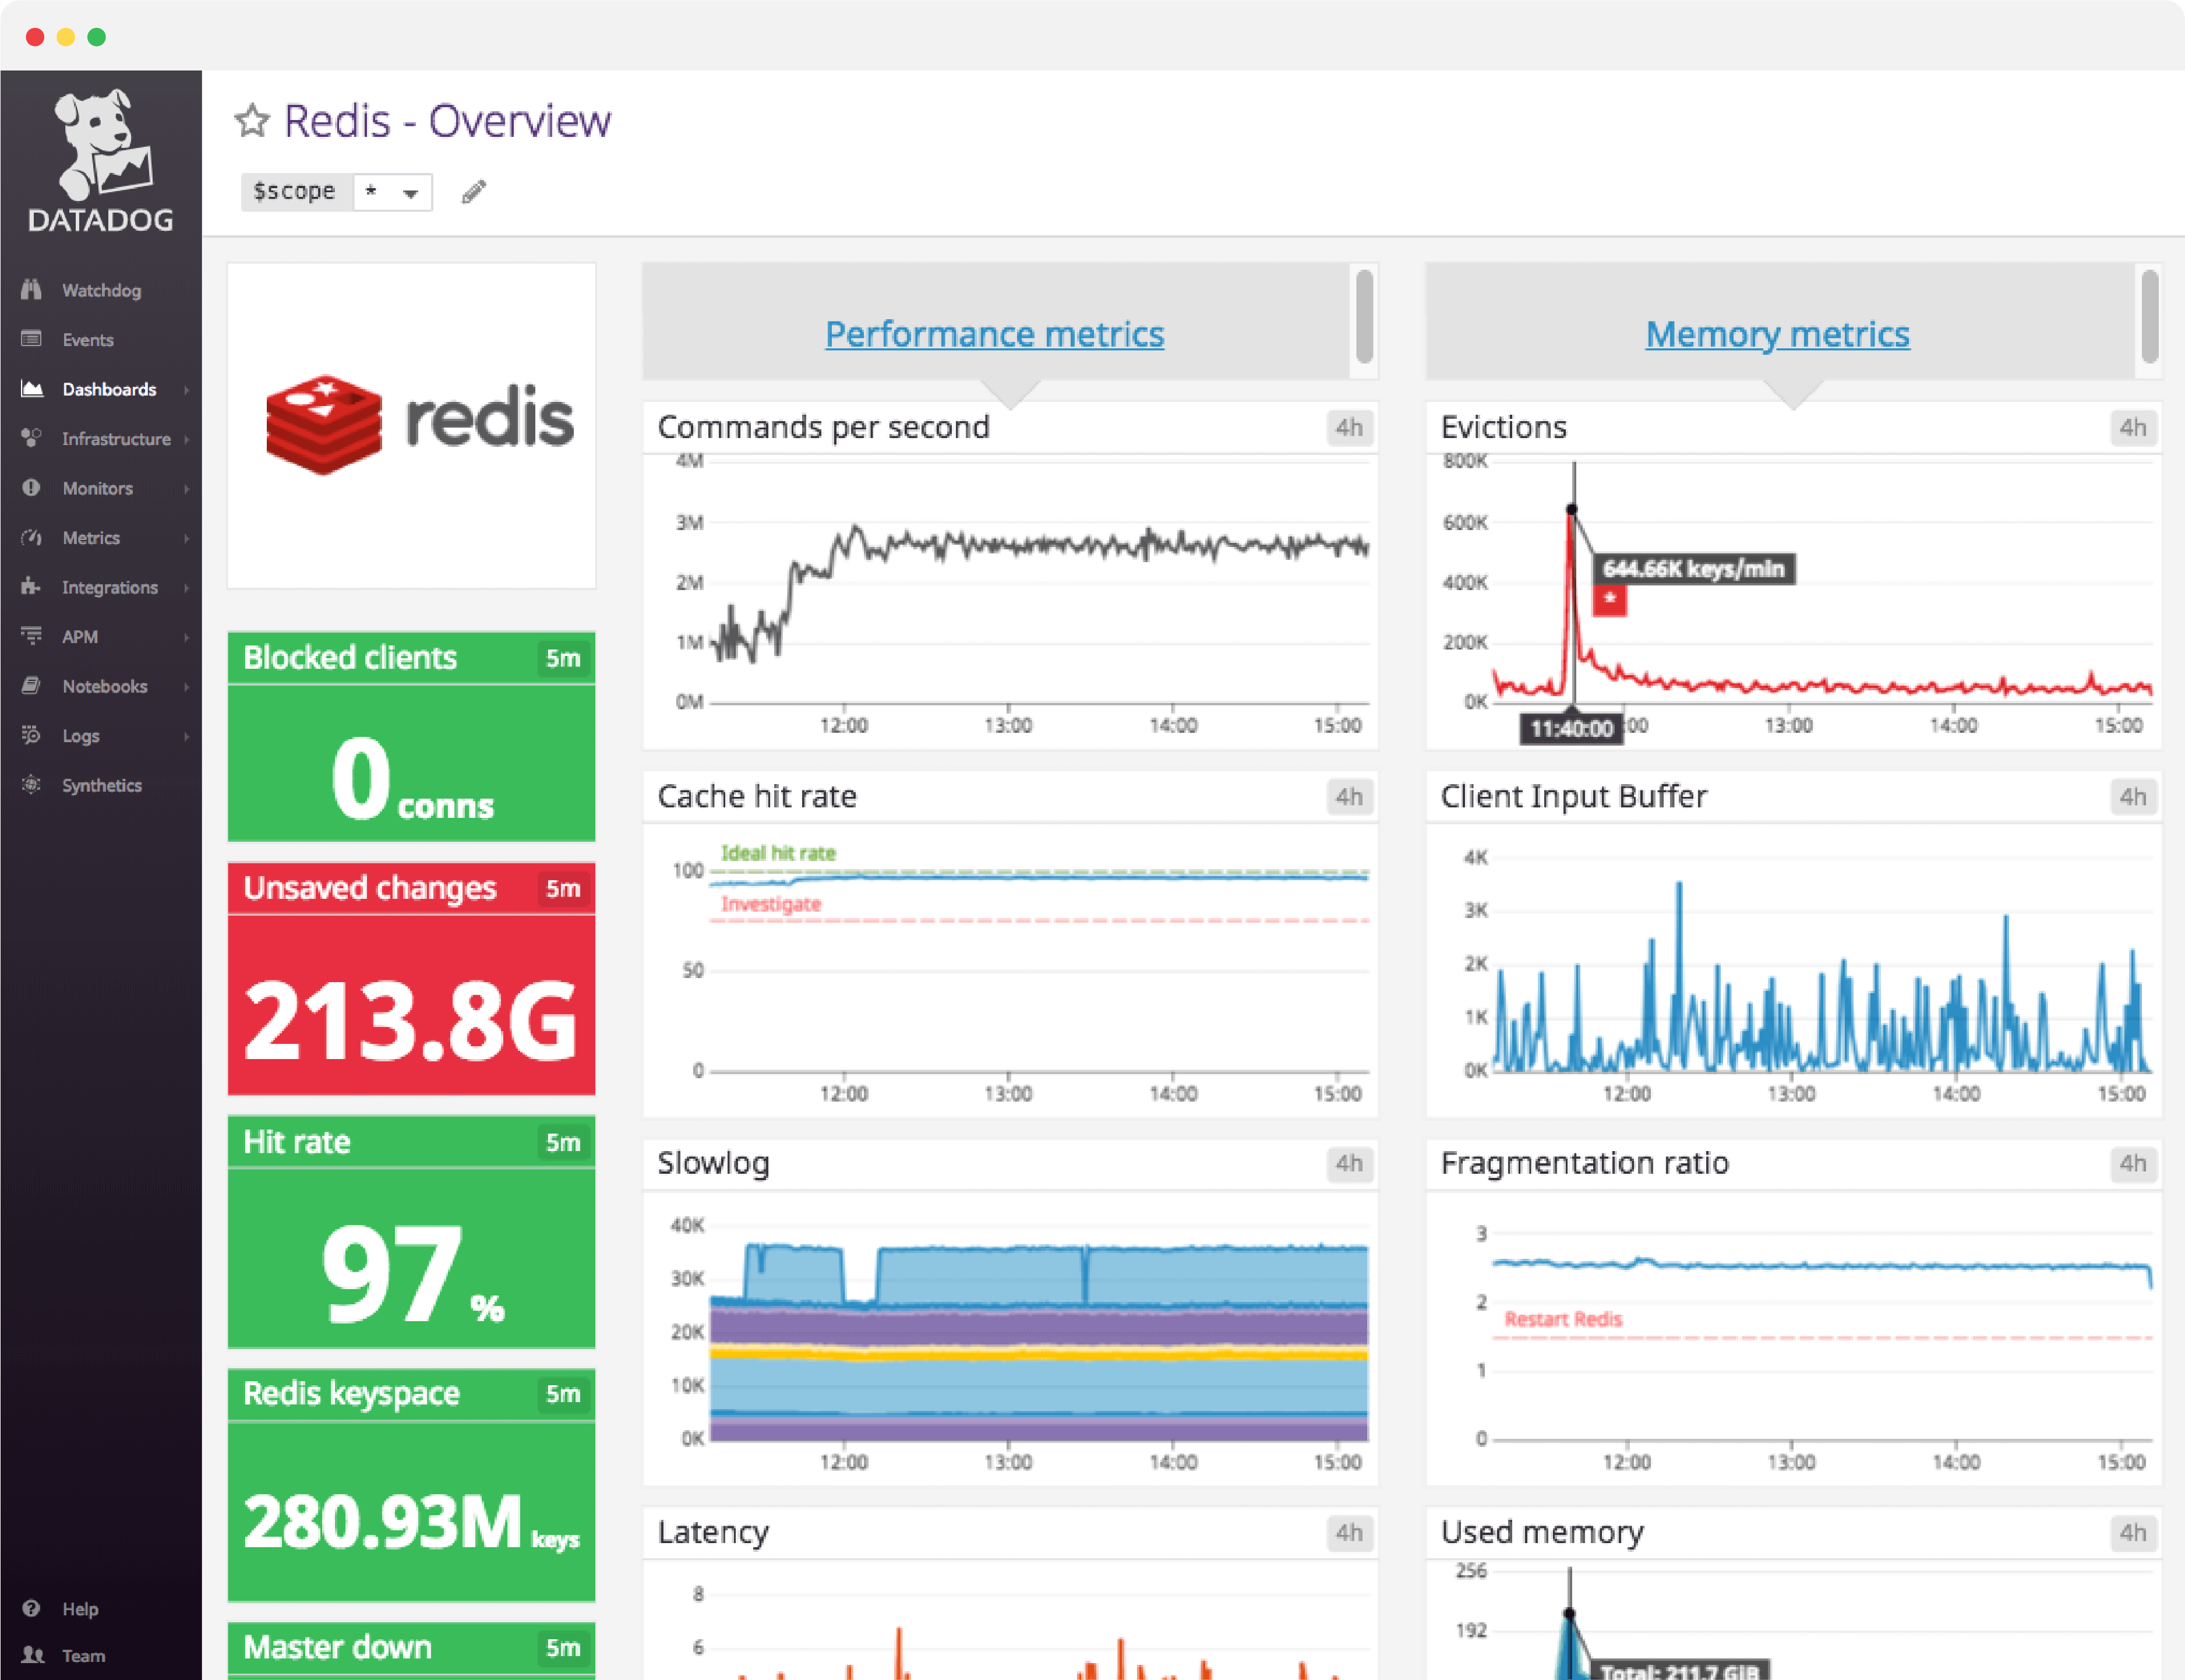
Redis dashboard overview
When setting up a Redis dashboard, there are two key problems you are trying to catch — resource issues with Redis itself and problems arising elsewhere in your supporting infrastructure. There are many necessary Redis metrics to track to achieve this and it is easiest to think of them in five separate metric categories: performance, memory, basic activity, persistence, and errors.
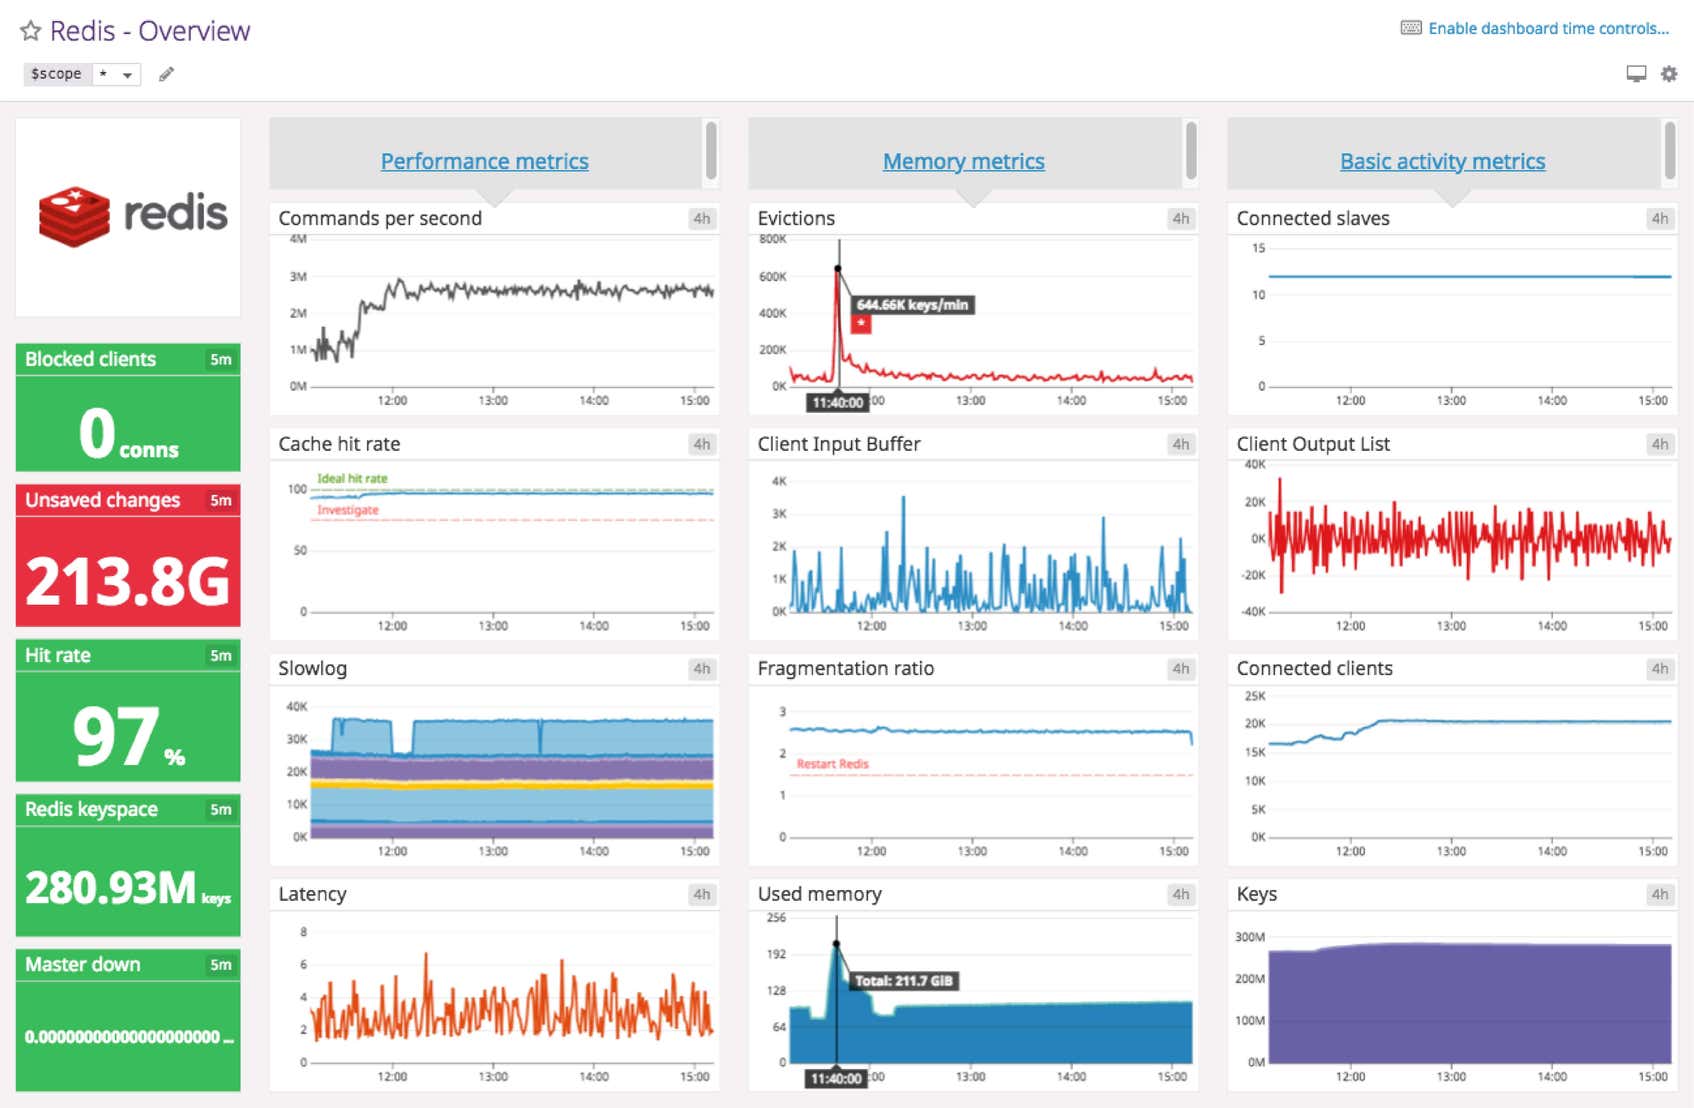
Datadog’s Redis dashboard visualizes the key metrics you should track in a single pane of glass. This page breaks down the metrics featured on that dashboard to provide a starting point for anyone looking to monitor Redis.
What is Redis?
Redis is an open source in-memory key/value data store. Due to its performance and simple onboarding, Redis has become a popular solution for multiple industries for use cases such as:
- Database: Focus on speed over durability with rich data primitives
- Message queue: A good backend for message broker service because of blocking list commands and low latency
- Memory cache: Configurable key eviction policies make Redis a great choice as a cache server
Set up real-time Redis monitoring in minutes with Datadog's out-of-the-box Redis dashboard.
Redis dashboard metrics breakdown
Redis performance metrics
Commands per second
When you experience high latency, tracking commands per second provides insight that helps with diagnostics. If commands per second is stable, you know that the latency issues are not caused by computationally-intensive commands. However, if one or more slow connections are causing latency issues, the number of commands per second would drop or stall completely.
Cache hit rate
This metric is especially important when using Redis as a memory cache. The query value indicates whether your cache is being used effectively or not.
A low hit rate means that clients are looking for keys that don’t exist. Possible causes include data expiration and insufficient memory allocated to Redis, which can increase latency of applications because they have to fetch data from slower, alternative resources.
Slowlog
The slowlog is a running list of executed commands which exceed a specific run time. Diving into the slowlog provides a low-level view of the commands that are causing increases in latency.
Latency (in ms)
Latency refers to the measurement of the time it takes between a client request and the actual server response. Because Redis is single-threaded, outliers in your latency distribution could cause serious bottlenecks for users.
Redis memory metrics
Evictions
This metric is especially important for the memory cache use case. In this case, you can configure Redis to automatically purge keys when the maxmemory limit is reached. Swapping may be preferable to evictions when using Redis as a database or queue.
Evicting a large number of keys can lead to lower hit rates and, thus, longer latency times.
Fragmentation ratio
This is the ratio of memory used by Redis to memory allocated to Redis. The operating system’s memory allocator will first attempt to find a contiguous memory segment to store the data for a process. If no contiguous segment is found, the allocator must divide the process’s data across segments, leading to increased memory overhead.
A fragmentation ratio greater than 1 indicates that fragmentation is occurring. A fragmentation ratio below 1 tells you that Redis needs more memory than is available on your system, which leads to swapping. Ideally, the operating system would allocate a contiguous segment in physical memory, with a fragmentation ratio equal to 1 or slightly greater.
Blocked clients
Redis offers blocking variants of its LPOP, RPOP, and RPOPLPUSH commands — BLPOP, BRPOP, and BRPOPLPUSH. When the source list is non-empty, the commands perform as you expect. However, when the source list is empty the blocking commands wait until the source is filled or a timeout is reached.
If this metric is consistently a non-zero value, you should investigate potential issues, such as latency, that prevent the source from being filled.
Used memory
When used_memory exceeds the total available system memory, the operating system will begin swapping old/unused sections of memory. Every swapped section is written to disk, severely impacting performance.
Tracking used memory is important because writing/reading from the disk is up to five orders of magnitude slower than reading/writing to memory.
Set up real-time Redis monitoring in minutes with Datadog's out-of-the-box Redis dashboard.
Redis basic activity metrics
Connected replicas
Editor’s note: The official name for this metric is redis.net.slaves, but Datadog does not use this terminology. This section replaces the word “slave” with “replica.”
If you are using the primary-replica database replication features available in Redis, monitoring the number of connected replicas is key. Should the number of connected replicas change unexpectedly, it could indicate a down host or problem with the replica instance.
Rejected connections
This is the number of connections rejected due to hitting the maxclient limit for the server instance. When this limit is reached, any new connection attempts will be ignored until the number of connections is below the maximum.
Connected clients
There will usually be reasonable upper and lower bounds for the number of connected clients because access to Redis is most often mediated by an application.
A low number of connected clients could indicate lost upstream connections. On the other hand, high numbers of connected clients indicate many concurrent client connections that can overwhelm the server’s ability to handle requests.
Redis keyspace
The larger the keyspace, the more physical memory Redis requires to ensure optimal performance. Redis continues to add keys until it reaches the maxmemory limit, at which point it begins evicting keys at the same rate new ones come in.
A “flatlining” keyspace metric can be correlated with hit rate in a cache use case to indicate clients requesting old or evicted data. In database or queue use cases, you can add more memory to your box or split datasets across hosts as your keyspace grows.
Redis persistence metrics
Unsaved changes
This is often measured in conjunction with db_last_save_time to provide insight into your data volatility. Long time intervals in this metric are acceptable if your data set hasn’t changed much. However, when tracked with last save time data, you can understand how much data would be lost should a server fail.
Redis error metrics
Primary down
Editor’s note: The official name for this metric is redis.replication.master_link_down_since_seconds, but Datadog does not use this terminology. This section replaces the word “master” with “primary.”
This metric is only available when the connection between a primary and its replica has been lost. The primary and replica should be in constant communication to ensure the replica is not serving up stale data.
In light of this constant communication, this metric should never exceed zero.
See your metrics in our Redis dashboard in minutes
If you’d like to start visualizing your Redis data in our out-of-the-box dashboard, you can try Datadog for free. The Redis dashboard will be populated immediately after you set up the Redis integration.
For a deep dive on Redis metrics and how to monitor them, check out our three-part How to Monitor Redis series.