Kafka dashboard overview
Kafka performance is best tracked by focusing on the broker, producer, consumer, and ZooKeeper metric categories. As you build a dashboard to monitor Kafka, you’ll need to have a comprehensive implementation that covers all the layers of your deployment, including host-level metrics where appropriate, and not just the metrics emitted by Kafka itself.
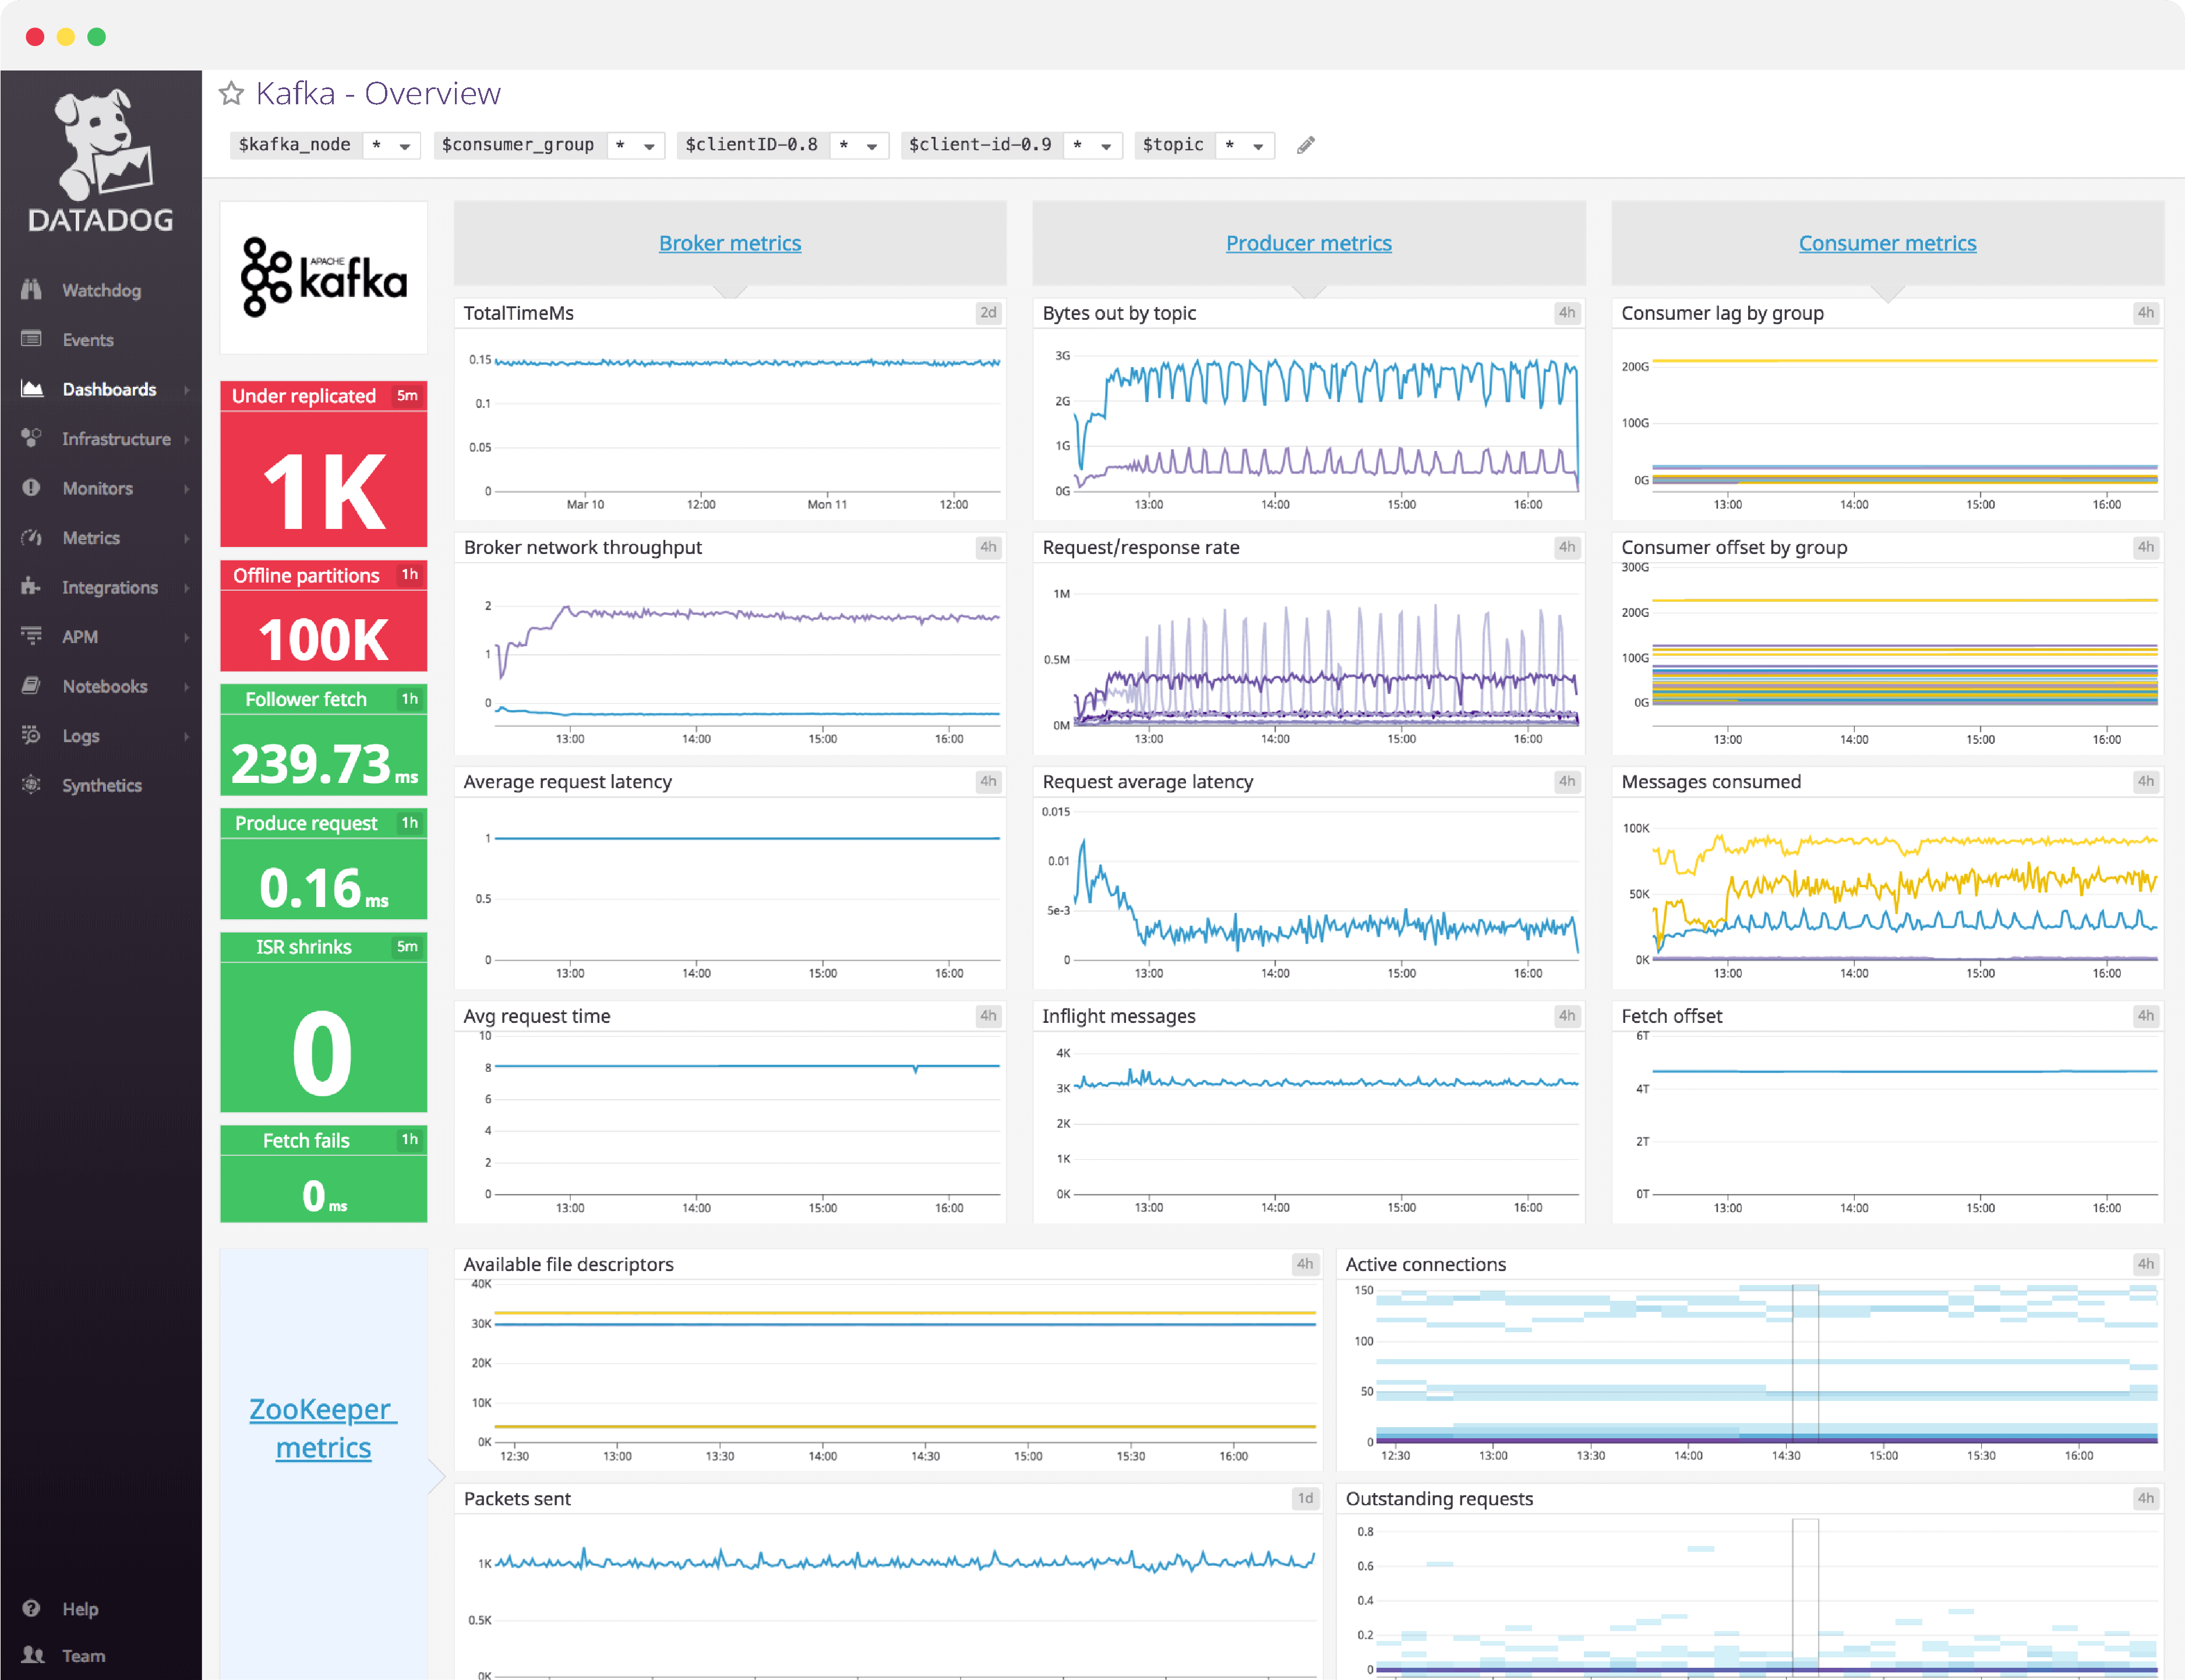
Datadog’s comprehensive Kafka dashboard displays key pieces of information for each metric category in a single pane of glass. This page breaks down the metrics featured on that dashboard to provide a starting point for anyone looking to monitor Kafka performance.
What is Kafka?
Apache Kafka is a distributed, partitioned, and replicated log service developed by LinkedIn and open sourced in 2011. It is a massively scalable pub/sub message queue architected as a distributed transaction log that has been used by a large number of high-profile companies including LinkedIn, Yahoo!, Netflix and Datadog.
Set up real-time Kafka monitoring in minutes with Datadog's out-of-the-box Kafka dashboard.
Kafka dashboard metrics breakdown
Broker metrics
Kafka broker metrics provide a window into brokers, the backbone of the pipeline. Because all messages must pass through a Kafka broker in order to be consumed, monitoring and alerting on issues as they emerge in your broker cluster is critical.
Clean/unclean leader elections
It is important to track the LeaderElectionRateAndTimeMs metric to understand the rate of leader elections (per second) and the total time the cluster went without a leader (in milliseconds).
You want to keep an eye on this metric because a leader election is triggered when contact with the current leader is lost, which could translate to an offline broker. Depending on the type of leader election (clean/unclean), it can even signal data loss.
Broker network throughput
Tracking network throughput on your brokers gives you more information as to where potential bottlenecks may lie, and can inform decisions like whether or not you should enable end-to-end compression of your messages.
Fetch/request purgatory
The number of produce and fetch requests added to purgatory.
Keeping an eye on the size of the request purgatory is useful to determine the underlying causes of latency. Increases in consumer fetch times, for example, can be easily explained if there is a corresponding increase in the number of fetch requests in purgatory.
TotalTimeMs
The TotalTimeMs metric family measures the total time taken to service a request (be it a produce, fetch-consumer, or fetch-follower request).
Under normal conditions, this value should be fairly static, with minimal fluctuations. If you are seeing anomalous behavior, you may want to check the individual queue, local, remote and response values to pinpoint the exact request segment that is causing the slowdown.
ISR delta
The difference between the reported values of IsrShrinksPerSec and IsrExpandsPerSec. The number of in-sync replicas (ISRs) should remain fairly static, the only exceptions are when you are expanding your broker cluster or removing partitions.
Under replicated
This metric monitors when partition replicas fall too far behind their leaders and the follower partition is removed from the ISR pool, causing a corresponding increase in the IsrShrinksPerSec metric.
Offline partitions
This metric is used to monitor the number of partitions without an active leader. A non-zero value for this metric should be alerted on to prevent service interruptions. Any partition without an active leader will be completely inaccessible, and both consumers and producers of that partition will be blocked until a leader becomes available.
Producer metrics
Kafka producers are independent processes which push messages to broker topics for consumption. Below are some of the most useful producer metrics to monitor to ensure a steady stream of incoming data.
Bytes out by topic
Monitoring the average number of outgoing/incoming bytes per second of producer network traffic will help to inform decisions on infrastructure changes, as well as to provide a window into the production rate of producers and identify sources of excessive traffic.
Request/response rate
The rate at which producers send data to brokers. Keeping an eye on peaks and drops is essential to ensure continuous service availability.
Request average latency
Average request latency is a measure of the amount of time between when KafkaProducer.send() was called until the producer receives a response from the broker.
Since latency has a strong correlation with throughput, it is worth mentioning that modifying batch.size in your producer configuration can lead to significant gains in throughput.
I/O wait
The percentage of time the CPU is idle and there is at least one I/O operation in progress. If you are seeing excessive wait times, it means your producers can’t get the data they need fast enough.
Consumer metrics
The following important consumer metrics track the performance and throughput of both simple and high-level consumers.
Consumer lag by group
ConsumerLag measures the difference between a consumer’s current log offset and a producer’s current log offset.
Bytes consumed
The BytesPerSec metric helps you monitor your consumer network throughput.
A sudden drop in MessagesPerSec could indicate a failing consumer, but if BytesPerSec remains constant, it’s still healthy, just consuming fewer, larger-sized messages.
Messages consumed
This metric monitors the rate of messages consumed per second, which may not strongly correlate with the rate of bytes consumed because messages can vary in size.
Monitoring this metric over time can help you discover trends in your data consumption and create baselines against which you can alert.
Min fetch rate
Measures the fetch rate of a consumer, which can be a good indicator of overall consumer health.
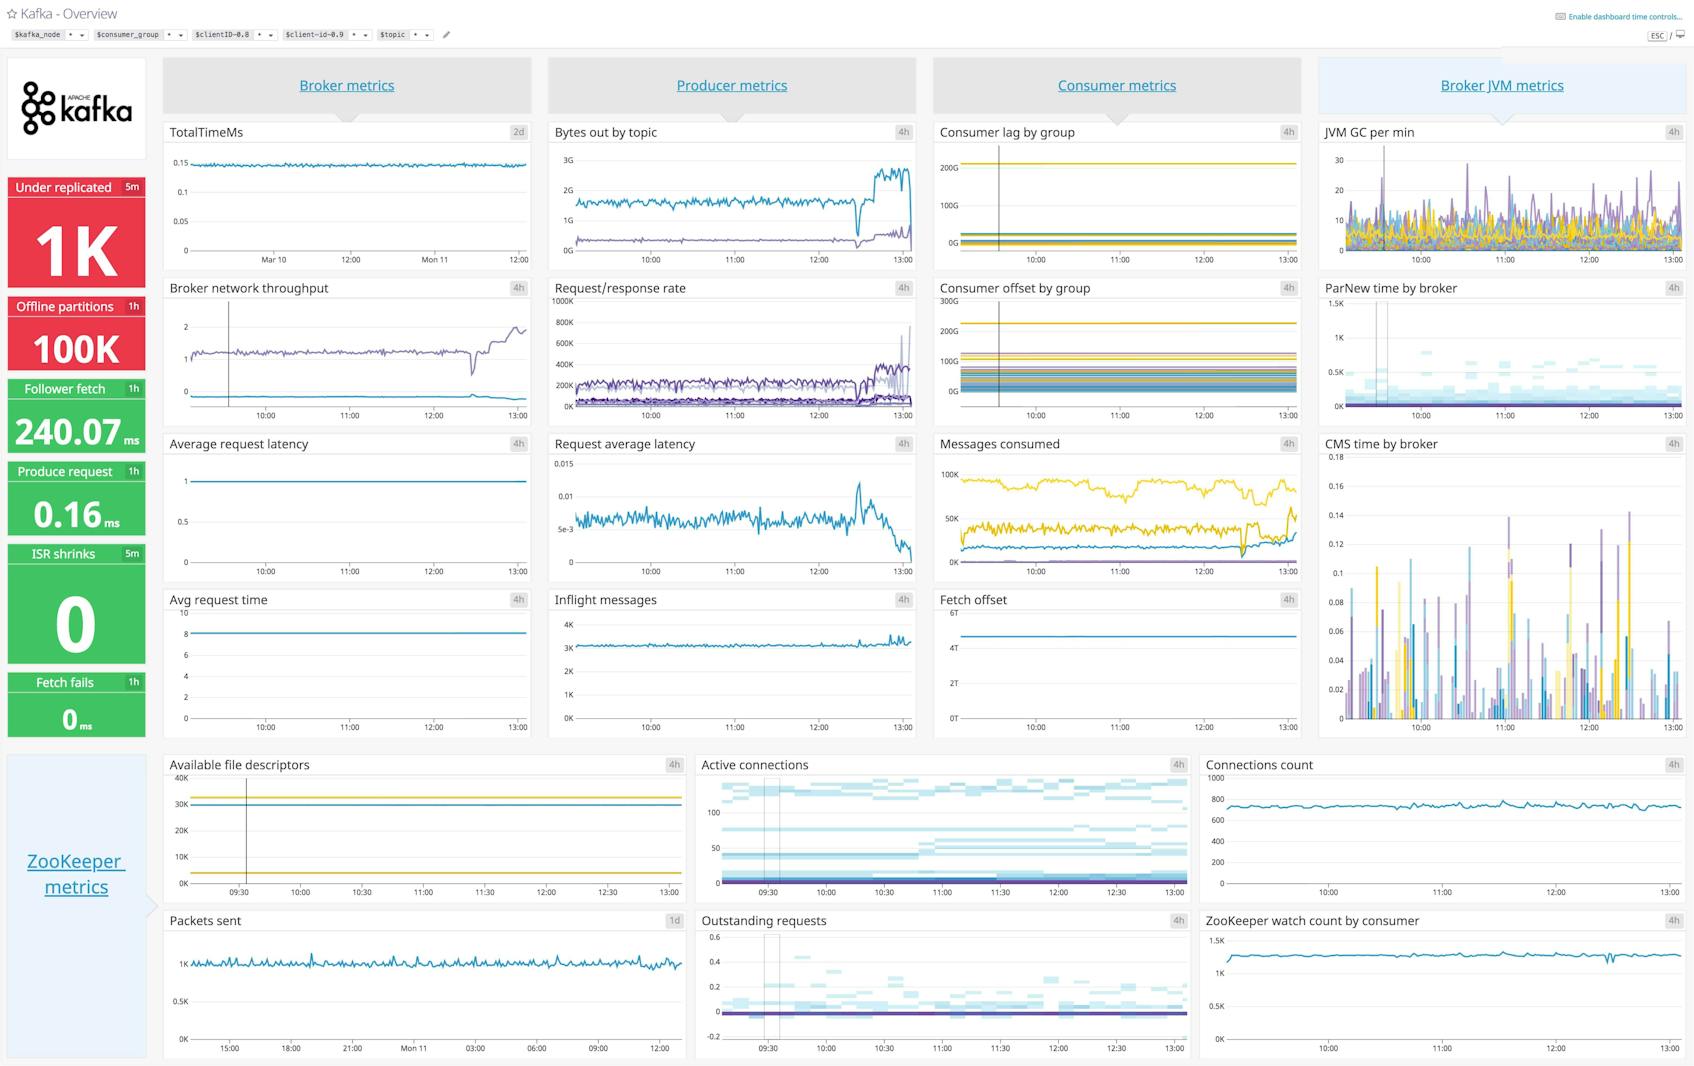
Broker JVM metrics
Because Kafka is written in Scala and runs in the Java Virtual Machine (JVM), it relies on Java garbage collection processes to free up memory. These are the essential metrics to monitor.
JVM GC per min
This monitors the JVM garbage collection processes that are actively freeing up memory. The more activity in your Kafka cluster, the more often the garbage collector will run.
ParNew time by broker
The young generation garbage collections monitored by this graph pause all application threads during garbage collection.
CMS time by broker
The ConcurrentMarkSweep (CMS) metric monitors the collections that free up unused memory in the old generation of the heap.
Set up real-time Kafka monitoring in minutes with Datadog's out-of-the-box Kafka dashboard.
ZooKeeper metrics
ZooKeeper plays an important role in Kafka deployments. It is responsible for maintaining consumer offsets and topic lists, leader election, and general state information. The following are important ZooKeeper metrics to monitor for Kafka.
Available file descriptors
Because each broker must maintain a connection with ZooKeeper, and each connection to ZooKeeper uses multiple file descriptors, you should keep an eye on the number of available file descriptors to ensure they are not exhausted after increasing the number of available file descriptors in your ZooKeeper ensemble.
Average request latency
The average time it takes (in milliseconds) for ZooKeeper to respond to a request.
Active connections
The number of clients connected to ZooKeeper. You should be aware of unanticipated drops in this value; since Kafka uses ZooKeeper to coordinate work, a loss of connection to ZooKeeper could have a number of different effects, depending on the disconnected client.
Outstanding requests
The zk_outstanding_requests metric tracks the number of client requests that can’t be processed by ZooKeeper.
Tracking both outstanding requests and latency can give you a clearer picture of the causes behind degraded performance.
Pending syncs
This metric monitors the transaction log, which is the most performance-critical part of ZooKeeper.
You should definitely monitor this metric and consider alerting on larger (> 10) values.
ZooKeeper commits/sec by consumer
The ZooKeeperCommitsPerSec metric tracks the rate of consumer offset commits to ZooKeeper.
If you consistently see a high rate of commits to ZooKeeper, you could consider either enlarging your ensemble, or changing the offset storage backend to Kafka.
See your own metrics in Datadog’s Kafka dashboard in minutes
If you’d like to start visualizing your Kafka metrics in our out-of-the-box dashboard, you can try Datadog for free. The Kafka dashboard will be populated immediately after you set up the Kafka integration.
For a deep dive on Kafka metrics and how to monitor them, check out our three-part How to Monitor Kafka series.