Amazon ElastiCache dashboard overview
An efficient cache can significantly increase your application’s performance and user navigation speed. That’s why understanding the metrics that contribute to your cache health is essential.
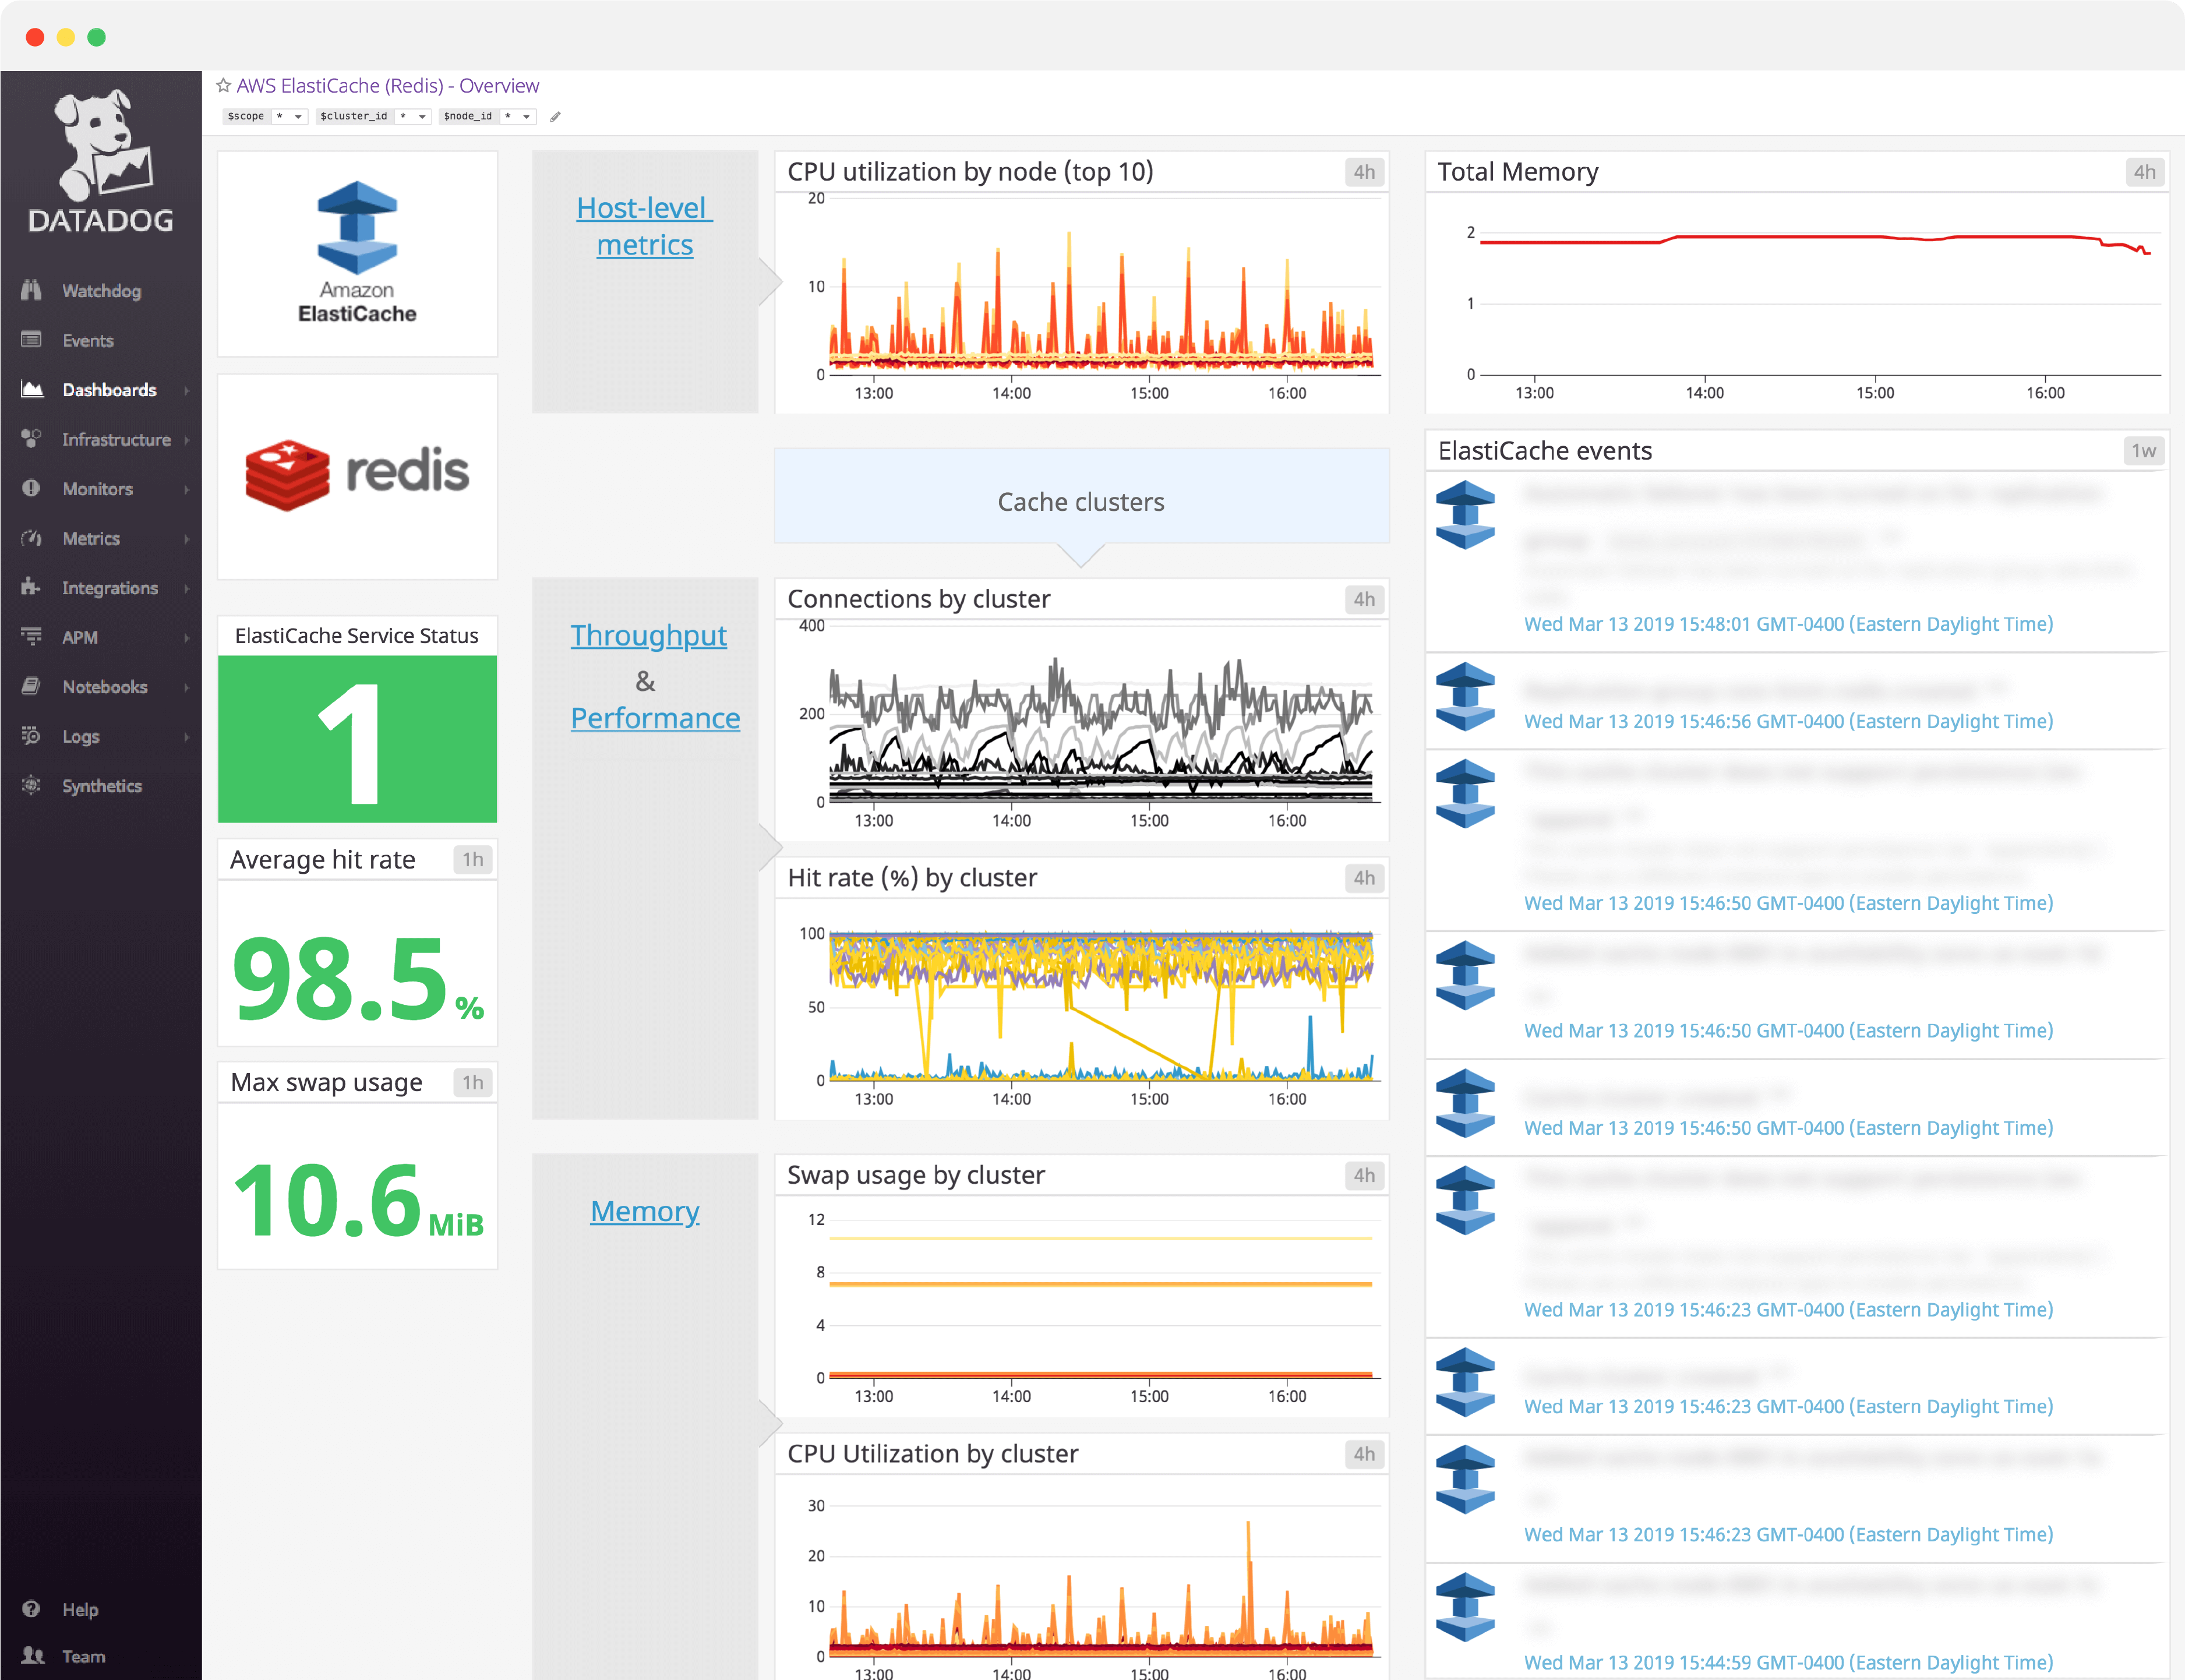
Datadog’s Amazon ElastiCache dashboard visualizes host-level, throughput, performance, and memory metrics in a single pane of glass. This page breaks down the metrics featured on that dashboard to provide a starting point for anyone looking to monitor ElasticCache using the Redis caching engine.
What is Amazon ElastiCache?
Amazon ElastiCache is a fully managed in-memory cache service offered through Amazon Web Services (AWS). Using a cache greatly improves throughput and reduces latency of read-intensive workloads.
AWS allows you to choose between Redis and Memcached as ElastiCache’s caching engine. Since it’s the most widely used caching engine, we will present the metrics best suited for an ElastiCache dashboard when using Redis below.
See real-time Amazon ElastiCache data in minutes with Datadog's out-of-the-box dashboard.
Amazon ElastiCache dashboard metrics breakdown
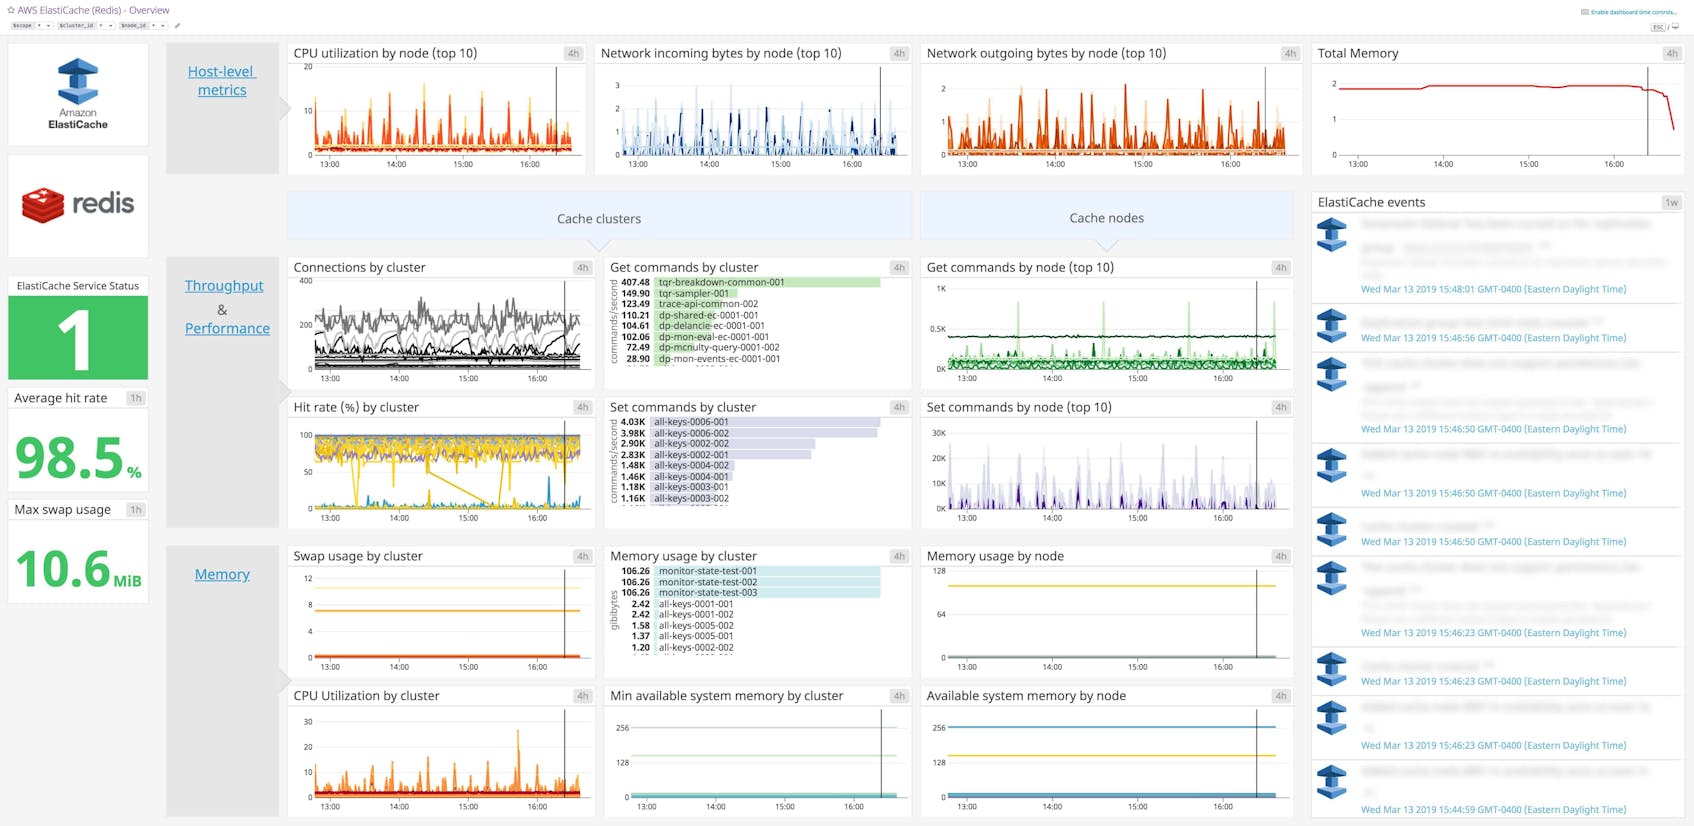
Host-level metrics
CPU utilization by node
It is important to track CPU utilization for each node because this metric can indirectly indicate high latency. AWS recommends that you set an alert threshold of 90 percent divided by the number of cores for the metric.
Network incoming bytes by node
The number of bytes read from the network by the host.
Network outgoing bytes by node
The number of bytes written to the network by the host.
Throughput and performance metrics
Connections by cluster
The number of current client connections to the cache. It is important to alert on this metric to make sure it never reaches the connections limit.
Hit Rate (%) by cluster
The hit rate is a measure of your cache efficiency and a calculation of cache hits and misses: (hits / (hits+misses). Cache hits are the number of requested files that were served from the cache without requesting to the backend. Misses are the number of times a request was answered by the backend because the item was not cached.
If your hit rate is too low, the cache’s size might be too small for the working data set. A high hit rate, on the other hand, helps to reduce your application response time, ensure a smooth user experience, and protect your databases.
Get commands by cluster
The number of Get commands received by your ElastiCache cluster.
Set commands by cluster
The number of Set commands received by your ElastiCache cluster.
Get commands by node
The number of Get commands received by your ElastiCache nodes.
Set commands by node
The number of Set commands received by your ElastiCache nodes.
When monitored alongside Get commands by node, you can check if all your nodes are healthy, and if the traffic is well-balanced among nodes.
Replication lag by node
This metric tracks the time taken for a cache replica to update changes made in the primary cluster. Monitoring this metric helps to ensure that you’re not serving stale data.
See real-time Amazon ElastiCache data in minutes with Datadog's out-of-the-box dashboard.
Memory metrics
Memory usage by node
Memory usage is critical for your cache performance. If it exceeds the total available system memory, the OS will start swapping old or unused sections of memory.
Memory usage by cluster
This metric reports memory usage, but this time per cluster.
Available system memory by node
This tracks the remaining memory on each host, which shouldn’t be too low, otherwise it can lead to swap usage.
Available system memory by cluster
This metric provides the memory remaining at the cluster level.
Swap usage by cluster
The SwapUsage host-level metric indicates when your system will run out of memory and the operating system will starts using disk to hold data that should be in memory.
Evictions by cluster
Evictions happen when the cache memory usage limit (maxmemory with Redis) is reached and the cache engine has to remove items to make space for new writes.
Evicting a large number of keys can decrease your hit rate, leading to longer latency times. If the number of evictions is growing, you should increase your cache size by migrating to a larger node type.
ElastiCache events
It is also important to track ElastiCache events, such as node addition failure or cluster creation. When correlated with ElastiCache metrics, these events can help investigate cache cluster activity.
Set up an Amazon ElastiCache dashboard in minutes with Datadog
If you’d like to start visualizing your Amazon ElastiCache data with our out-of-the-box dashboard, you can try Datadog for free. The ElastiCache dashboard will be populated immediately after you set up the Amazon ElastiCache integration.
For a deep dive on ElastiCache metrics and how to monitor them, check out our three-part How to Monitor ElastiCache series.