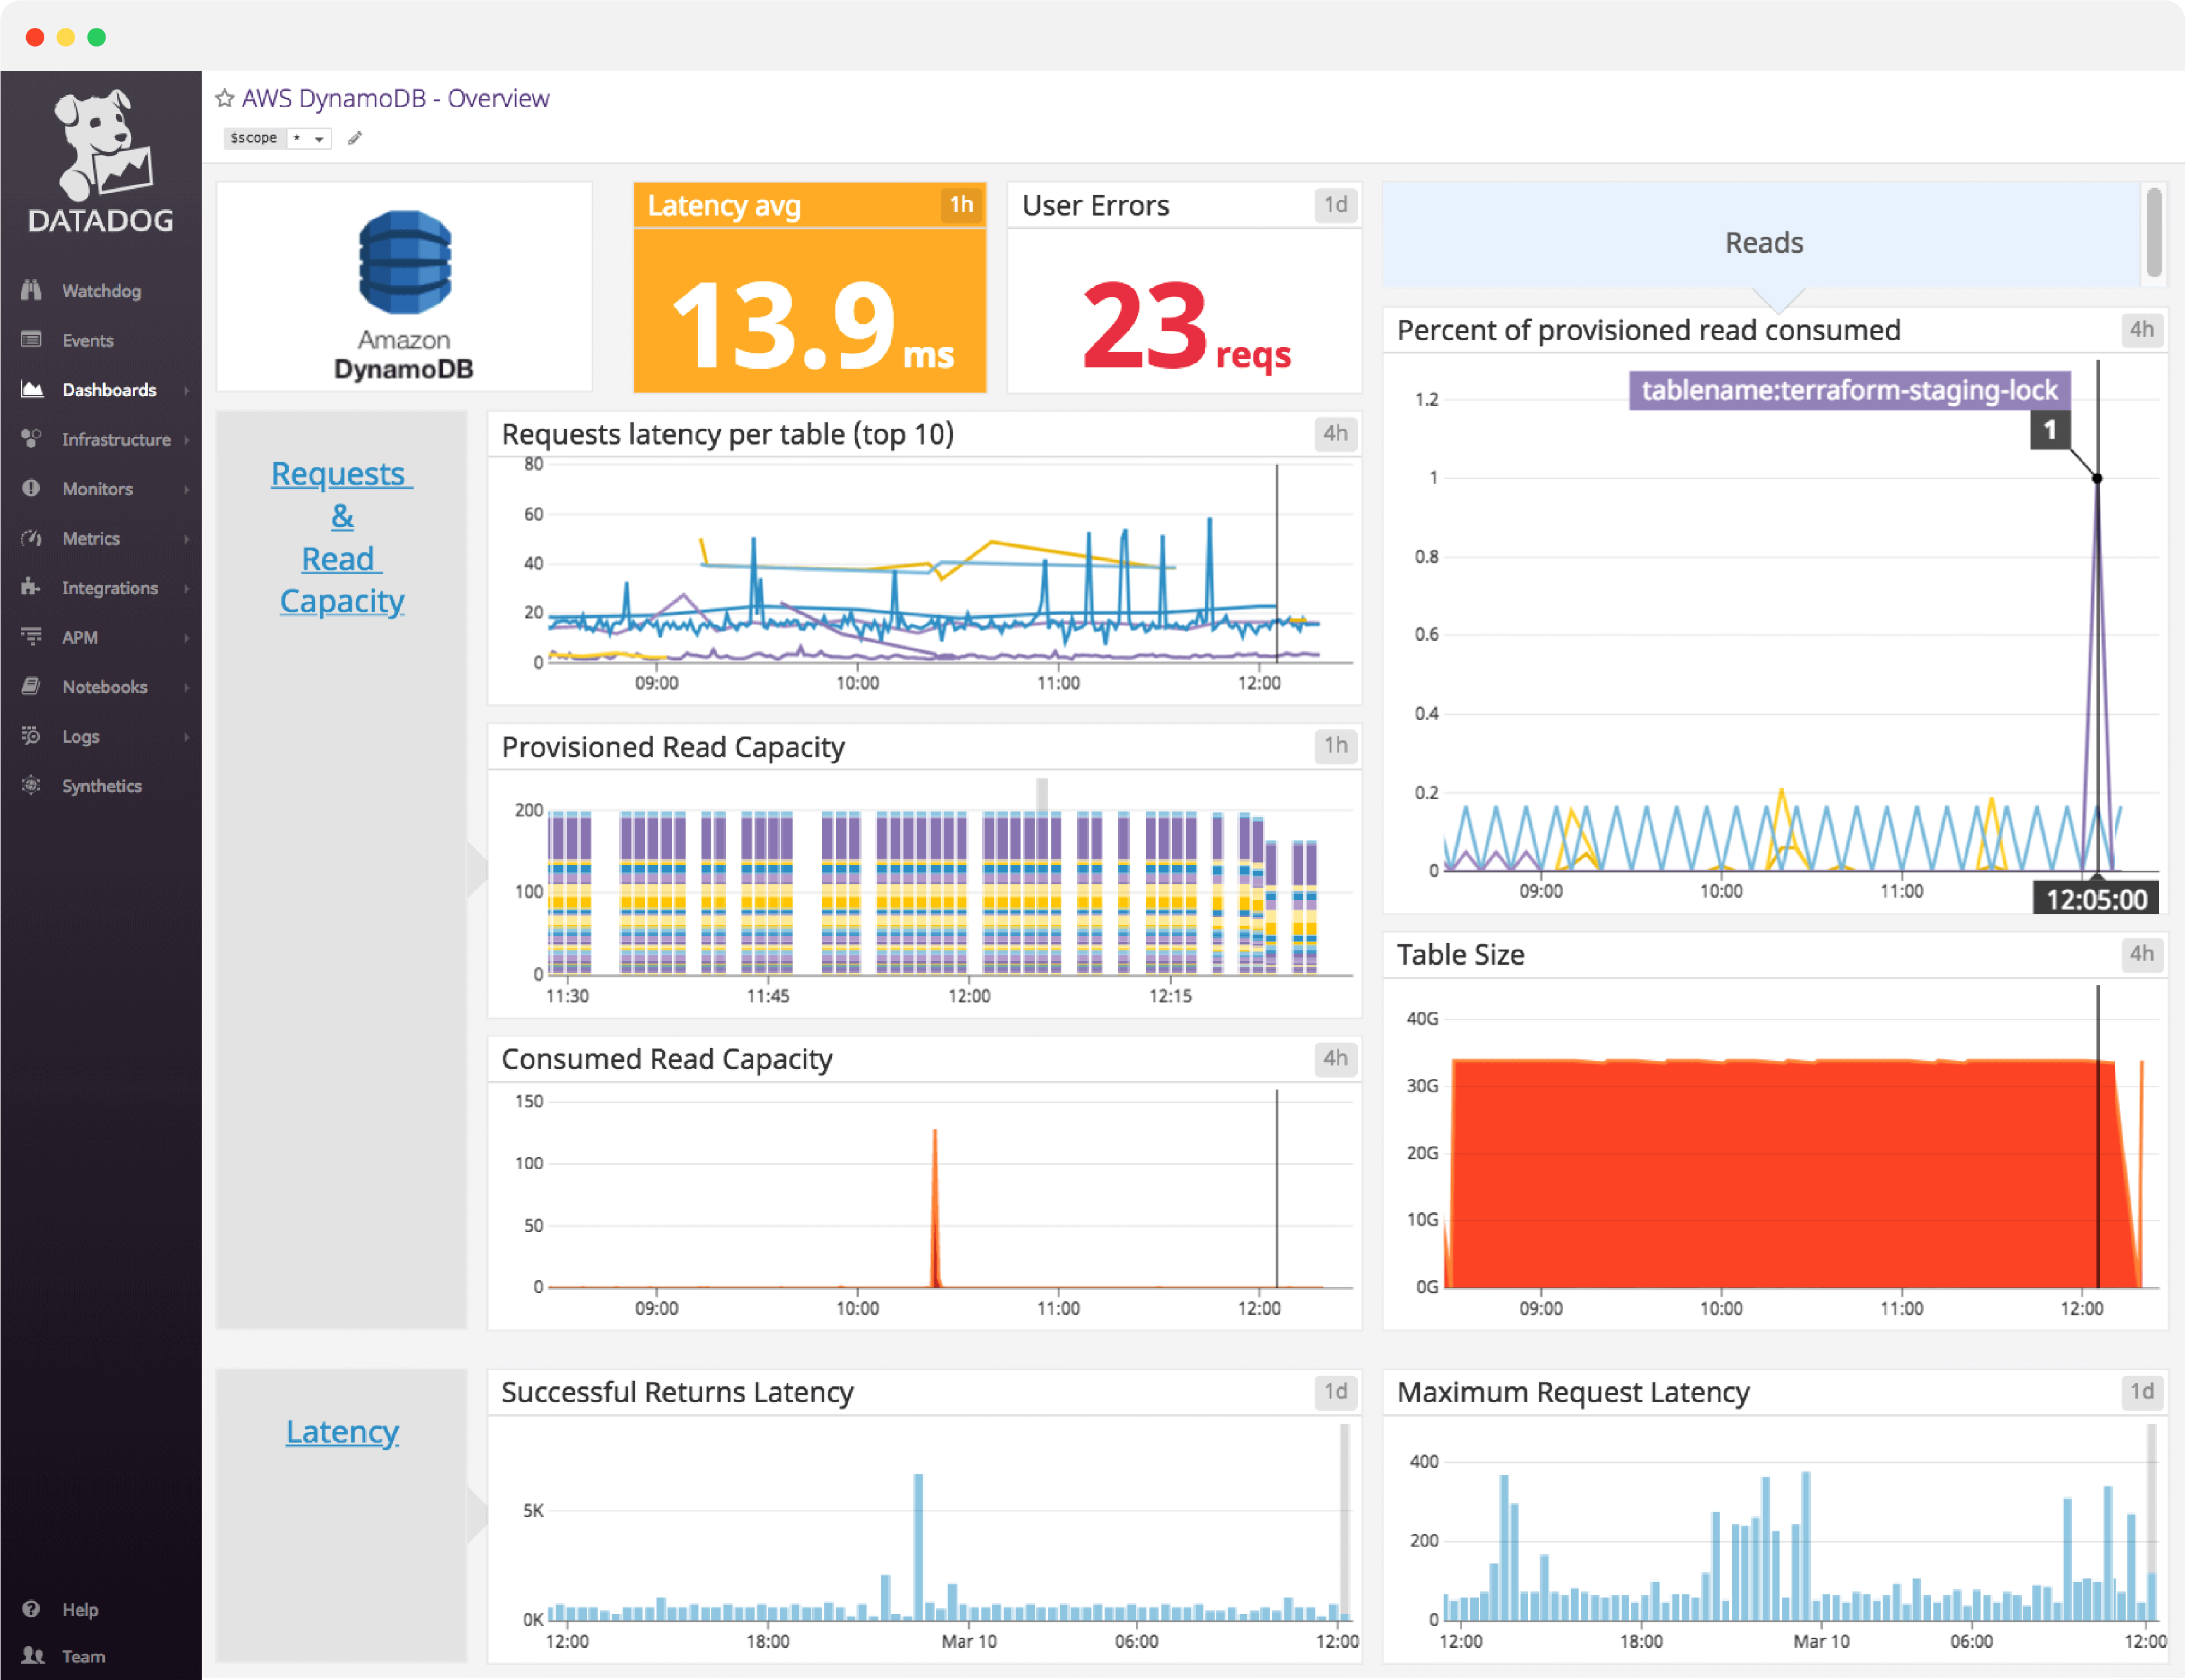
DynamoDB dashboard overview
When building a dashboard, you should focus on metrics that can help you ensure availability and data durability for services that rely on DynamoDB. These metrics can largely be collected from DynamoDB via AWS CloudWatch.
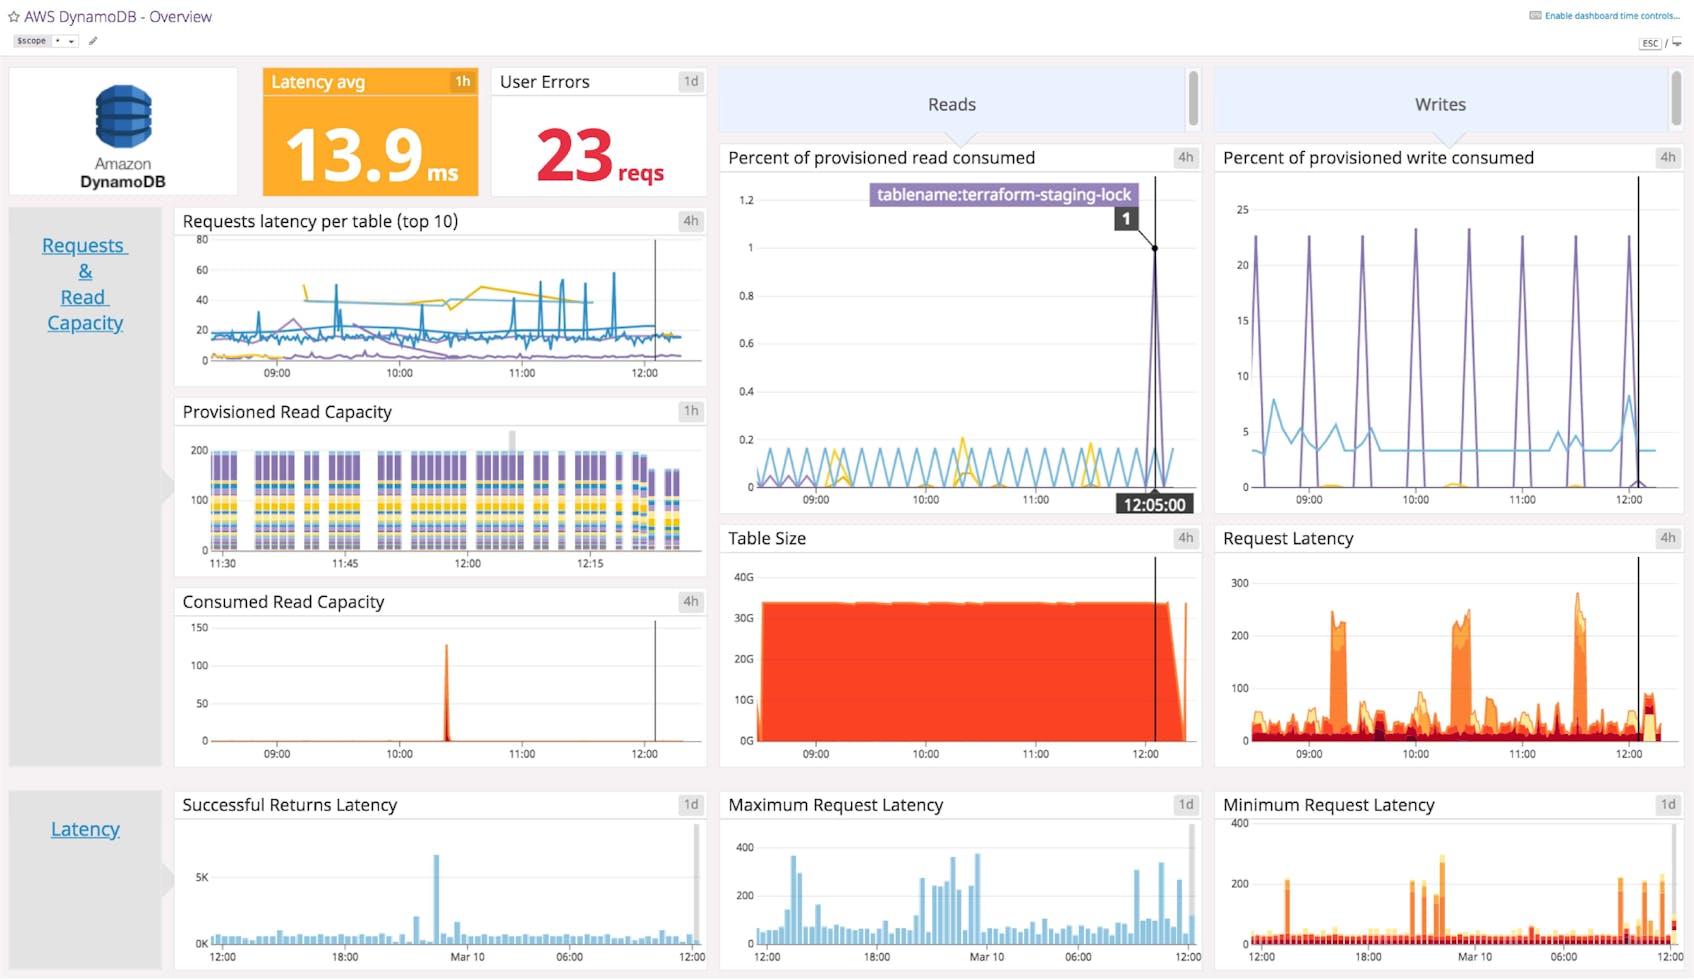
Datadog’s DynamoDB dashboard visualizes information on latency, errors, read/write capacity, and throttled request in a single pane of glass. This page breaks down the metrics featured on that dashboard to provide a starting point for anyone looking to monitor DynamoDB.
What is DynamoDB?
Amazon DynamoDB is a fully managed NoSQL database cloud service that is part of the AWS portfolio. Fast and easily scalable, it is meant to serve applications which require very low latency, even when dealing with large amounts of data. It supports both document and key-value store models, and has properties of both a database and a distributed hash table.
Set up real-time DynamoDB monitoring in minutes with Datadog's out-of-the-box dashboard.
DynamoDB dashboard metrics breakdown
Throttling metrics
Throttled requests
When a client request triggers at least one read or write event that exceeds your provisioned throughput, the request is throttled by DynamoDB. Because throttled requests can execute slowly (after a retry) or fail altogether, throttling is usually a worrisome occurrence. If you set an alert for before it is exhausted, you may be able to provision more read or write capacity and avoid throttled requests.
Throttled reads/writes per table
Throttling occurs when the requested number of read or write events for a table exceeds the provisioned capacity of that table. Ranking events by maximum value over time can help identify the tables that have seen the most throttling.
Percent of provisioned read/write consumed
Tracking this metric over time (one for reads and one for writes) shows how much of the provisioned capacity for each table has been consumed. When a table’s throughput is not fully used, DynamoDB saves a portion of the unused capacity for future “bursts” of read or write throughput. Therefore, read or write capacity can briefly spike above 100 percent due to bursting.
Most throttled tables
When monitored over time this metric provides insights on the tables with the highest peak rates of throttled requests. This view is useful for identifying capacity bottlenecks on individual tables.
Throttling
This metric tracks the total number of throttled requests over time across all tables. When observed over time this graph is useful for identifying when throttling events have occurred, and whether the throttling was confined to one particular table or spread across multiple tables.
Errors
System errors
This metric breaks down of the number of system errors, summed by table, over time. System errors represent requests that resulted in a HTTP 500 (server error) code. Under normal circumstances this metric should be equal to zero.
User errors
This metric breaks down the number of user errors, summed by table, over time. User errors represent requests that resulted in a HTTP 400 (client error) code, such as a request with an authentication failure. If your client application is interacting correctly with DynamoDB, this metric should always be equal to zero.
Failed conditional write attempts
This metric breaks down the number of failed conditional writes, summed by table, over time. With DynamoDB, you can define a logical condition for a write request that defines whether or not the item can be modified. If this logical condition returns “false”, this metric is incremented and a 400 error (Bad request) is returned. This error type is counted separately from user errors.
See your DynamoDB data in the out-of-the-box Datadog DynamoDB dashboard in minutes.
Latency metrics
Latency average
When tracked over time this metric provides the average response time (in milliseconds) of successful requests. Abnormally high latency levels are cause for concern. Note that this metric only covers the execution time of successful requests so requests that succeed only after a retry will appear in normal latency ranges, despite taking longer to complete.
Request latency per table
This metric offers the average response time (in milliseconds) of successful requests, broken down by table, over time. Tracking this can help you identify whether requests for any particular table are executing slowly.
Events
In addition to the key metrics graphed on this dashboard, it is also important to keep an eye on the discrete occurrences, or events, that relate to your DynamoDB database. These can include Amazon notifications, such as changes to a table’s provisioned throughput, as well as alert notifications that mention DynamoDB.
See your metrics in Datadog’s DynamoDB dashboard in minutes
If you’d like to start visualizing your DynamoDB data in our out-of-the-box dashboard, you can try Datadog for free. The DynamoDB dashboard will be populated immediately after you set up the DynamoDB integration.
For a deep dive on DynamoDB metrics and how to monitor them, check out our three-part How to Monitor DynamoDB series.