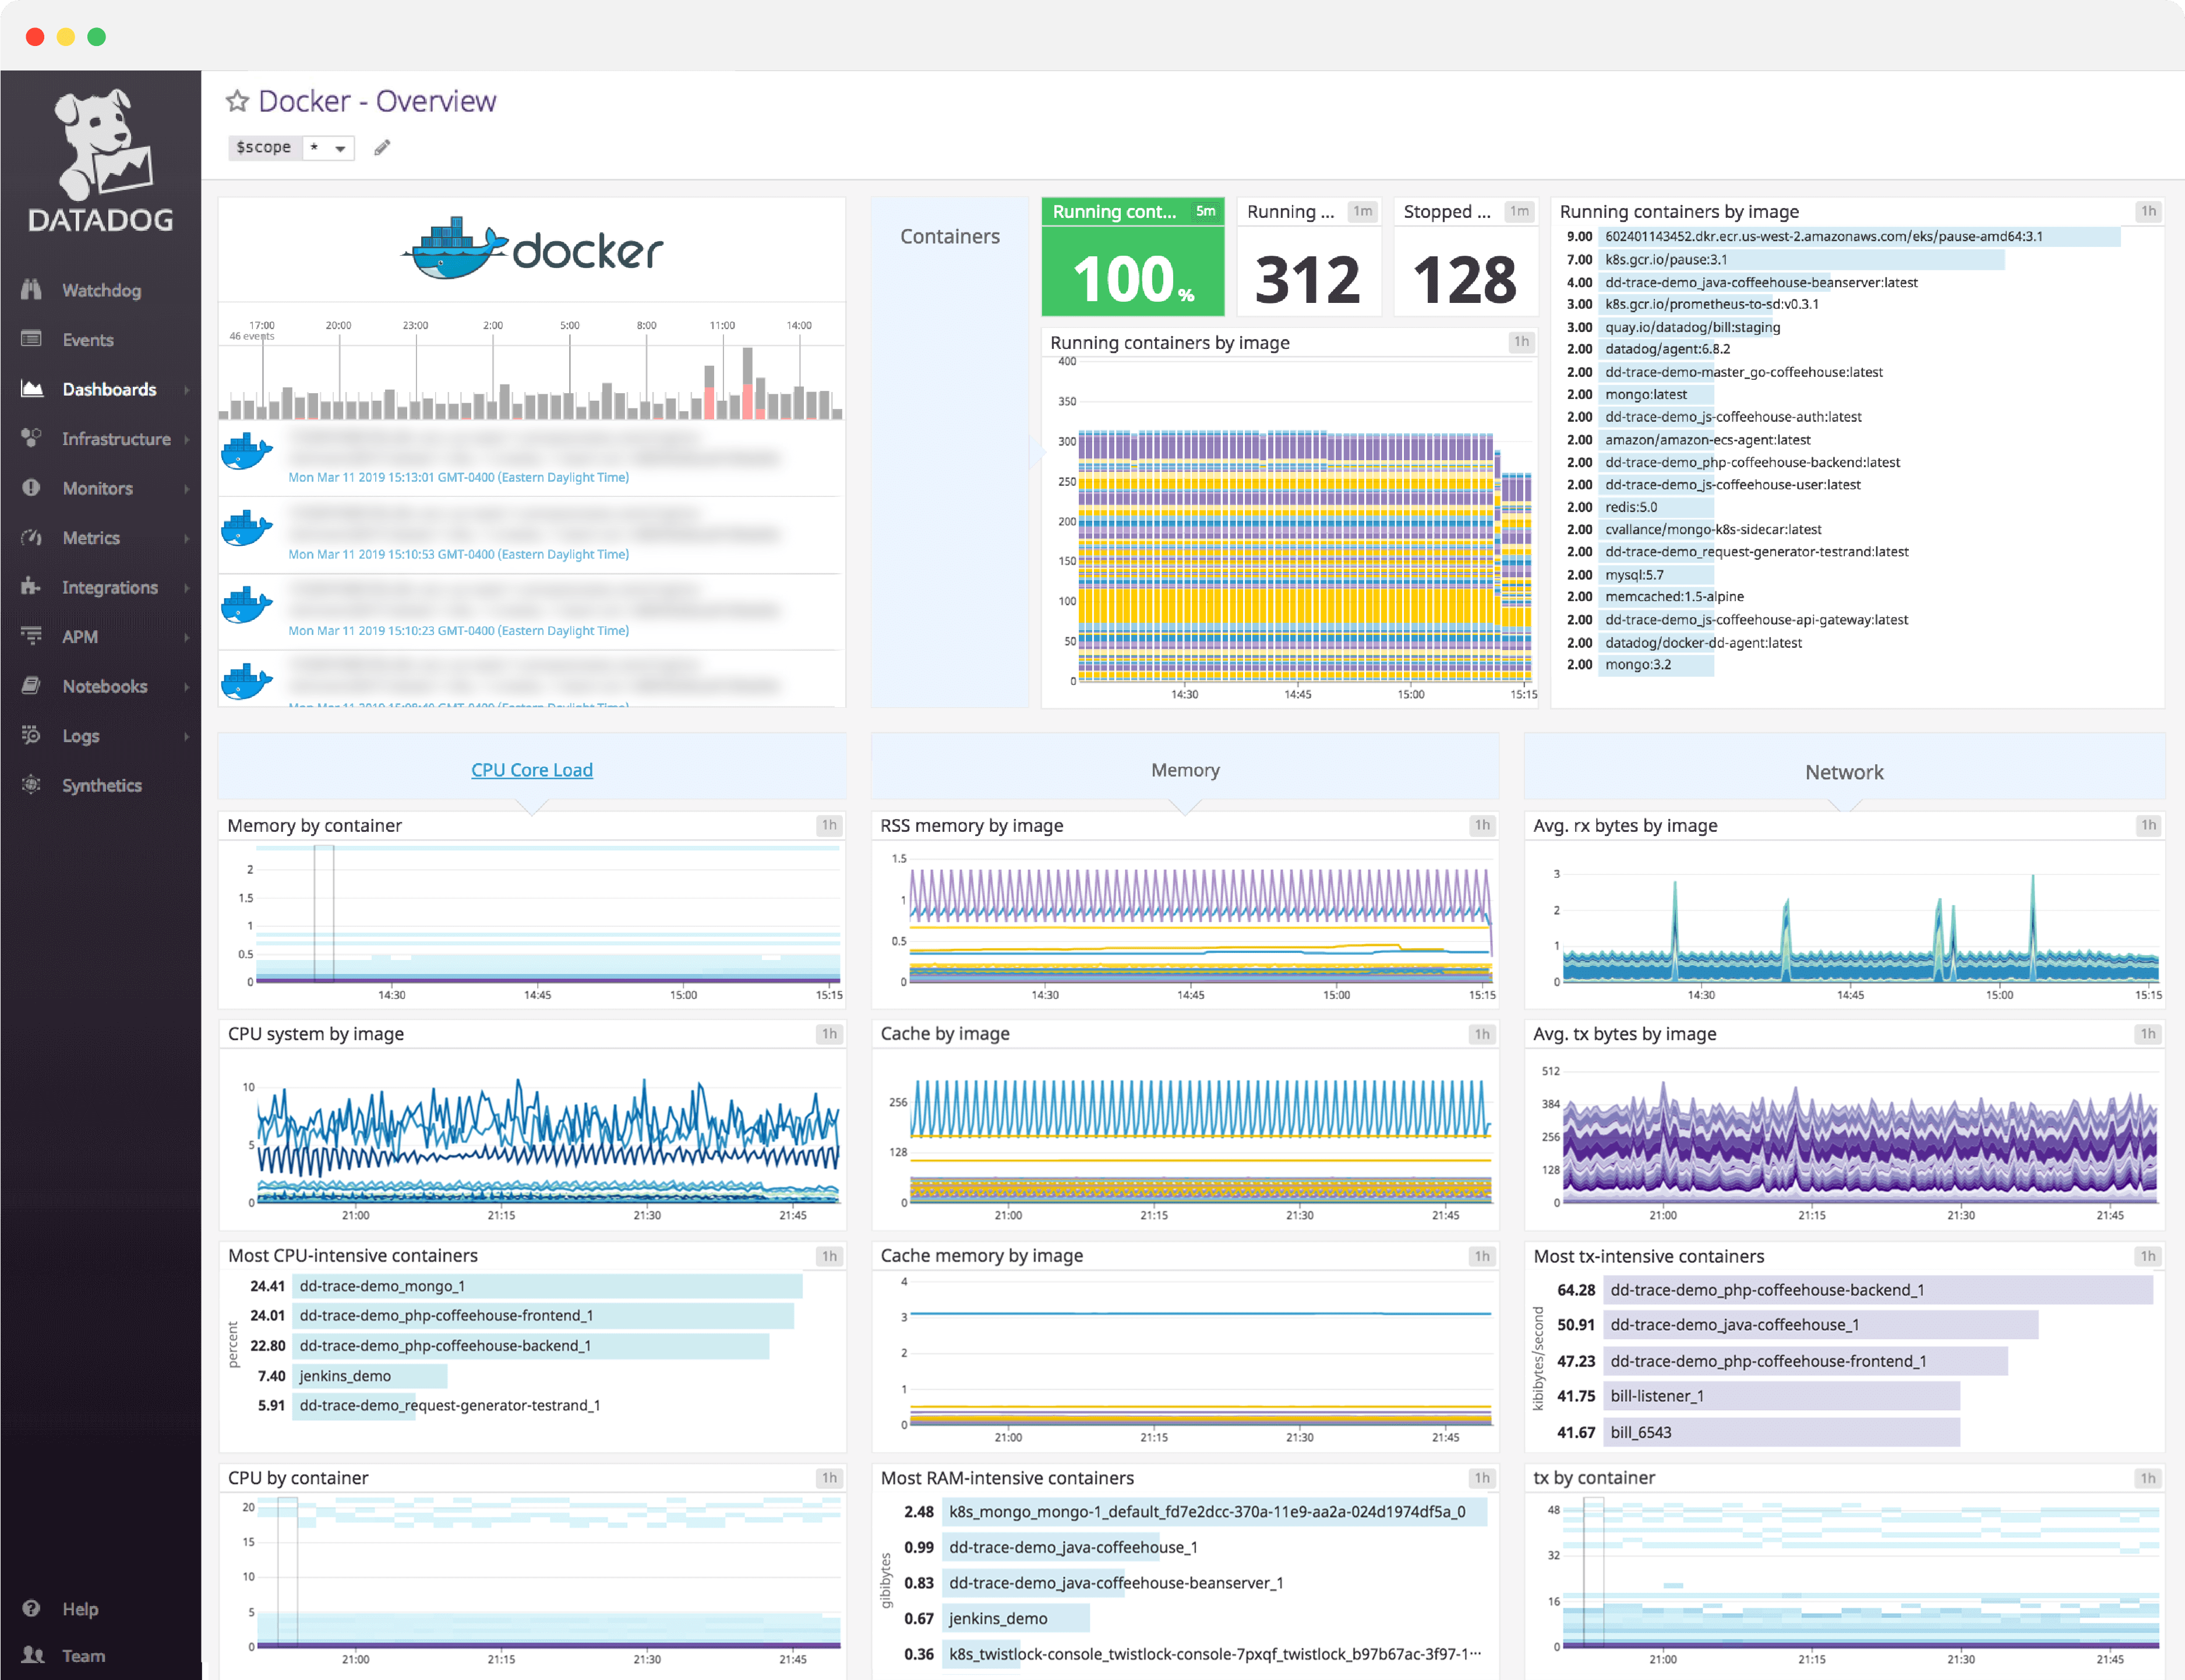
Docker dashboard overview
When deploying services using Docker it is important to understand resource utilization and identify any potential resource constraints in your containerized infrastructure. As such, you should track Docker events and container status as well as CPU, memory, I/O, and network metrics.
Datadog’s Docker dashboard visualizes these important events, container health, and resource metrics in a single pane of glass. This page breaks down the information featured on that dashboard to provide a starting point for anyone looking to monitor Docker.
What is Docker?
Docker is a popular open-source technology designed to help deploy, scale, and operate applications using containers. A container is a lightweight virtual runtime, which provides software isolation, among other benefits. You can think of containers as easily-configured, lightweight VMs that start up fast, often in under one second. Docker and other container technologies are ideal for microservice architectures and for environments that scale rapidly or release often.
Set up real-time Docker monitoring in minutes with Datadog's out-of-the-box dashboard.
Docker dashboard metrics breakdown
Events
Event timeline
An event timeline helps track Docker events over time. Events are any discrete occurrence reported by Docker, such as a container’s creation, startup, or destruction.
Event stream
A Docker event stream captures detailed information on each Docker event, such as the name of the host, the name of the Docker image, and the exact nature of the event.
Container status
Running container change
By tracking the query value to show how many containers are running now, as compared to five minutes ago, you can stay aware of sudden changes in the number of running Docker containers.
Running containers
This metric displays the number of Docker containers currently running.
Stopped containers
This query-value presents the number of Docker containers that have been stopped but not deleted.
Running containers by image
Monitoring running containers by image allows you to see if any particular image is dominating the container count or has experienced dramatic population changes, which may be due to faulty configuration or container management.
Set up real-time Docker monitoring in minutes with Datadog's out-of-the-box dashboard.
CPU metrics
CPU user by image
CPU user time is an especially valuable metric as it represents the percentage of time that CPU is under direct control of processes. Tracking the average CPU user time for each Docker image over time can help you identify whether any particular image is CPU-bound.
CPU system by image
The CPU system time metric represents the percentage of time that CPU is executing system calls on behalf of processes.
CPU by container
This metric breaks CPU usage down by container name. Tracking this information over time allows you to see the overall range of your containers’ CPU usage, any outliers, and which containers (as opposed to images) have had the highest peak levels of CPU user time.
Memory metrics
RSS memory by image
RSS (resident set size) is the amount of non-cache data that belongs to a process: stacks, heaps, etc. Breaking down the RSS memory by image helps identify which images are the most memory-intensive, and which may be memory-constrained.
Swap by image
When a container needs to free up memory, it can swap inactive RSS memory to disk as necessary. Low levels of swapping can be tolerated in some applications, but because reading from disk can be orders of magnitude slower than reading from memory, significant swap usage can cause serious performance problems. You can keep an eye on this by tracking how much swap space is in use, on average, for each Docker image.
Cache memory by image
This metrics tracks the cache memory usage of each Docker image. Cache memory, distinct from RSS memory, reflects data stored on disk that is currently cached in memory. Inactive cache may be reclaimed first when the system needs memory.
Memory by container
This metric breaks down RSS memory usage by container name. Tracking this information over time allows you to see the overall range of your containers’ RAM usage, identify memory-hungry outliers, and which containers (as opposed to images) have had the highest peak levels of RSS memory usage. Network metrics
Avg. rx bytes by image
This metric tracks the inbound network traffic for each Docker image. Tracking inbound and outbound traffic by image over time is useful for identifying containerized services that may be network-limited, or that may be suffering performance problems due to transient network issues.
Avg. tx bytes by image
This metric tracks the outbound network traffic for each Docker image. Tracking inbound and outbound traffic by image over time is useful for identifying containerized services that may be network-limited, or that may be suffering performance problems due to transient network issues.
Most tx-intensive containers
Ranks which containers (as opposed to images) have had the highest peak levels of network transmission over a timeframe. Note that if you have multiple containers with the same name (for example, identical containers on different hosts), this ranking will display the average of the network metrics across those containers.
tx by container
This metric breaks down outbound network throughput by container name. Tracking this information over time allows you to see the overall range of your containers’ network transmission rates, identify any network-saturating outliers, and which containers (as opposed to images) have had the highest peak levels of network transmission.
See your own Docker data in minutes with Datadog's out-of-the-box Docker dashboard.
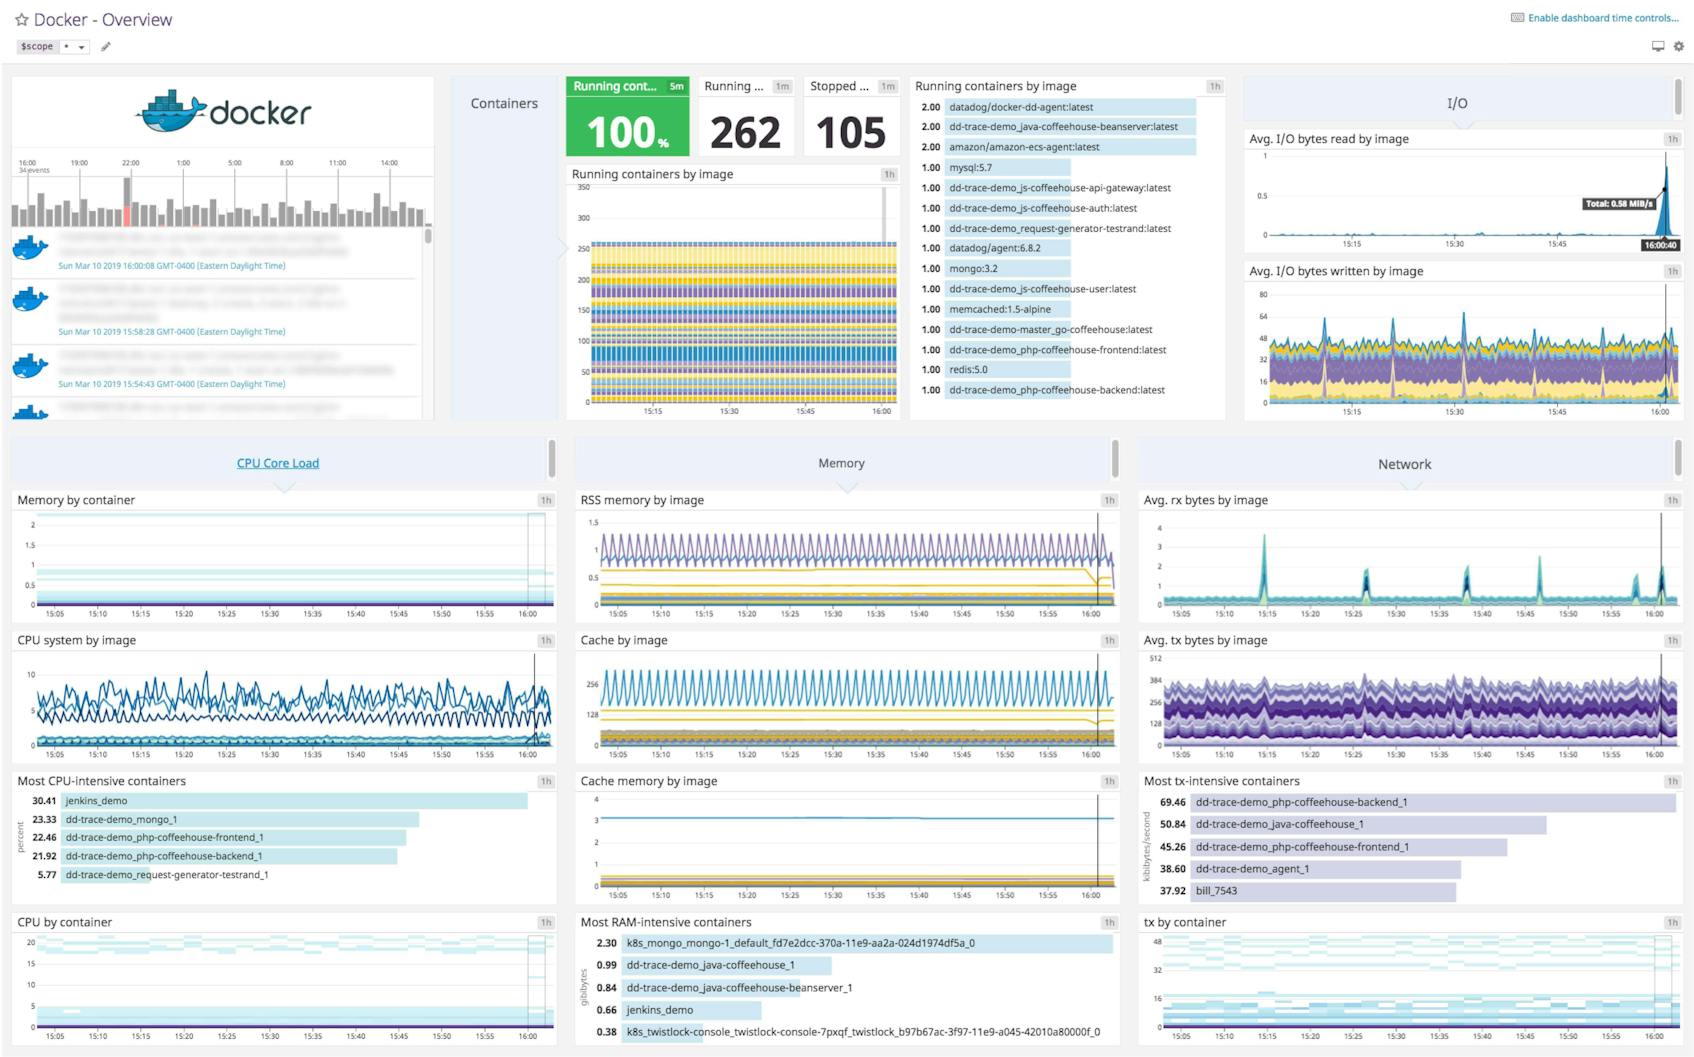
I/O metrics
Avg. I/O bytes read by image
The average number of bytes that have been read from disk by each Docker image over a timeframe. I/O for each block device is shared, so you should investigate host-level I/O metrics if you notice anomalies at the container level. Your container’s I/O rates will be affected if queue lengths or service times are increasing on a block device that your container uses.
Avg. I/O bytes written by image
The average number of bytes that have been written to disk by each Docker image over a timeframe. I/O for each block device is shared, so you should investigate host-level I/O metrics if you notice anomalies at the container level. Your container’s I/O rates will be affected if queue lengths or service times are increasing on a block device that your container uses.
Monitor everything in one place with Datadog’s Docker dashboard
If you’d like to start visualizing your Docker data in our out-of-the-box dashboard, you can try Datadog for free. The Docker dashboard will be populated immediately after you set up the Docker integration.
For a deep dive on Docker metrics and how to monitor them, check out our four-part How to Monitor Docker series.