Chef dashboard overview
As a central component in your infrastructure, Chef should be closely monitored to ensure that the automation features you depend on are working correctly and efficiently. Connecting the Chef framework to Datadog enables you to:
- Receive real-time reports on Chef client runs
- Track key Chef performance metrics across all your servers
- Quickly identify infrastructure issues and resolve them with your team
Datadog’s comprehensive Chef dashboard displays all the important metrics to track Chef runs and performance in a single pane of glass. This page breaks down the information featured on that dashboard to provide a starting point for anyone looking to monitor Chef configuration management for their infrastructure.
What is Chef?
Chef is an open source “infrastructure as code” framework that helps you automate your infrastructure and applications. Chef is designed to manage scalable, dynamic infrastructure in any environment.
Set up real-time Chef monitoring in minutes with Datadog's out-of-the-box Chef dashboard.
Chef dashboard metrics breakdown
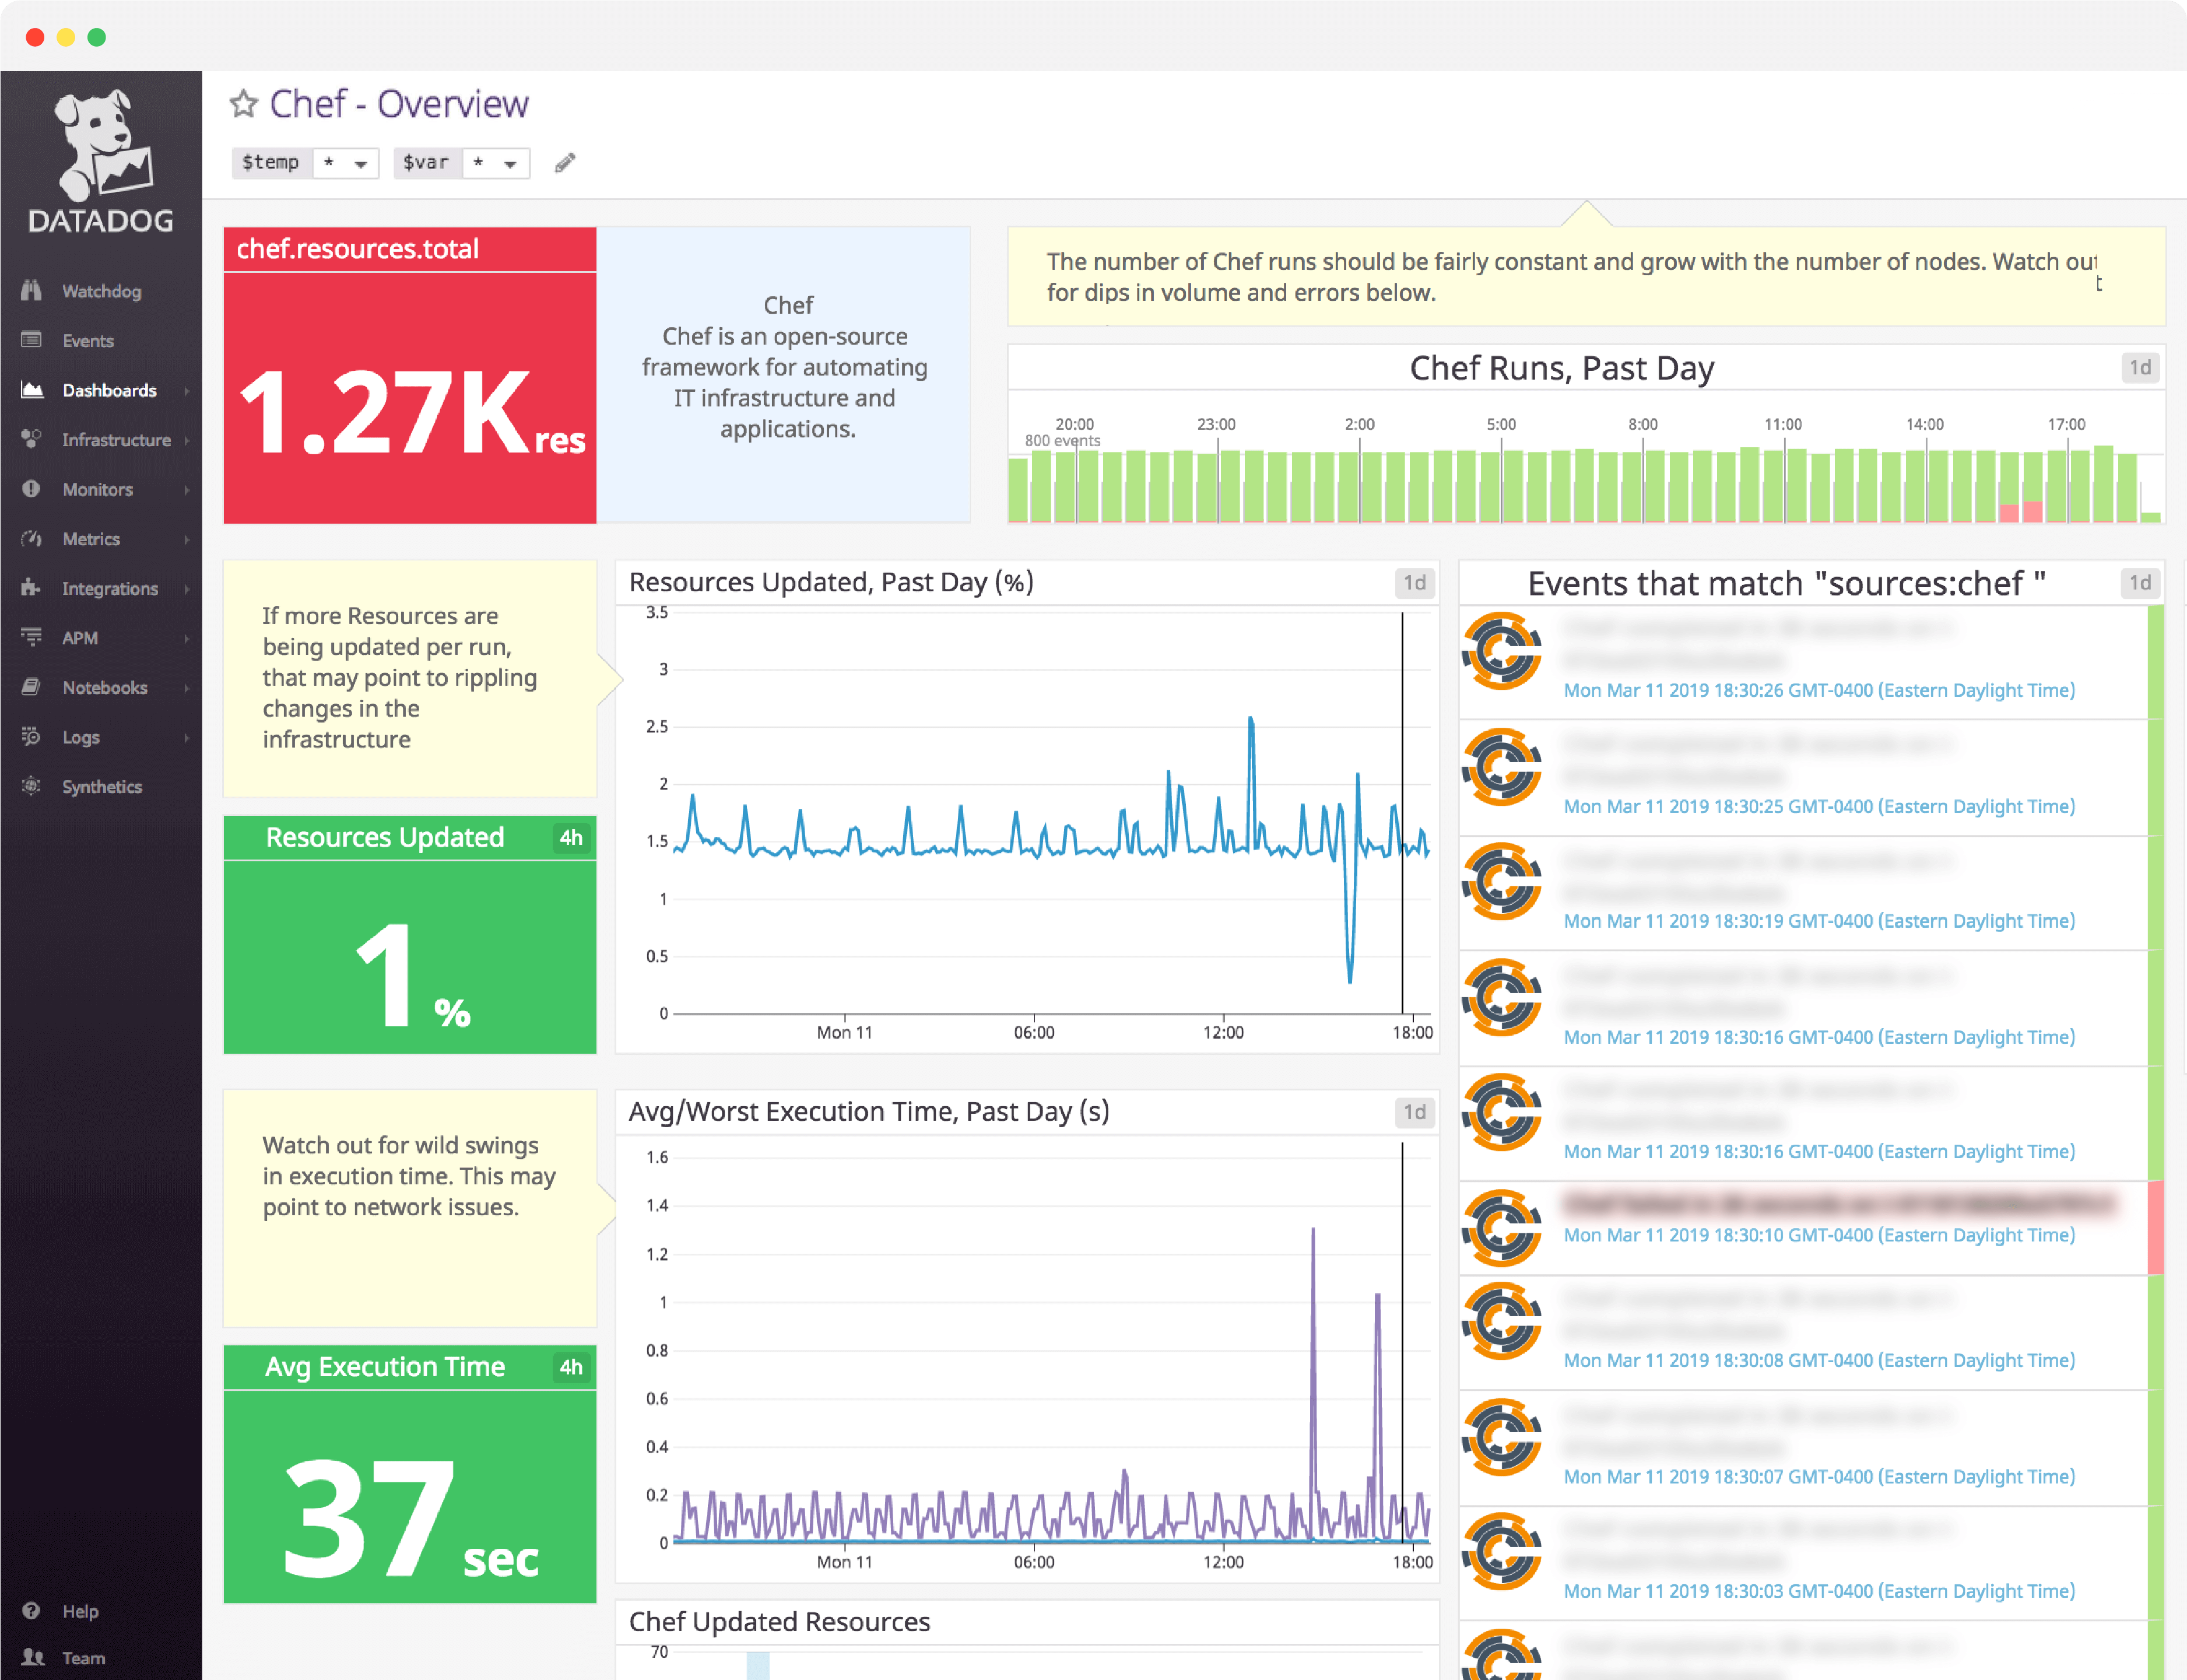
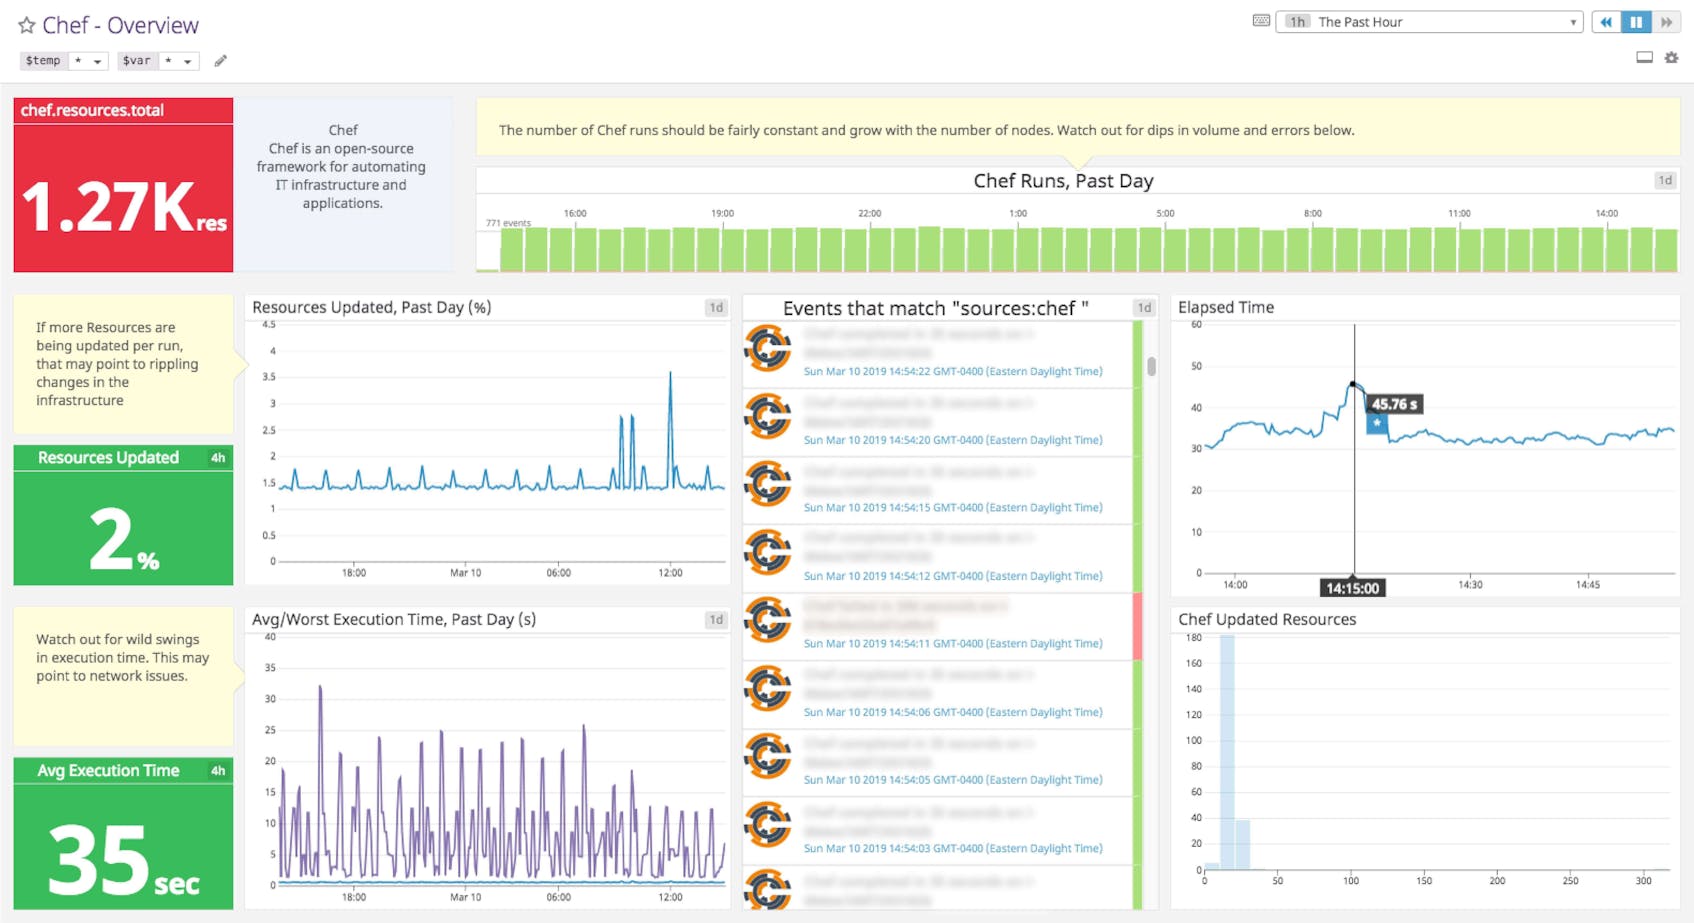
Resources updated (%)
The chef.resources.updated metric tracks how many resources are updated in each Chef run. By comparing this metric with the chef.resources.total metric tracking the total count of managed resources you can measure the percentage of resources updated per run.
If you start to see more resources being updated per run, that may point to rippling changes in the infrastructure.
Chef runs
In the Chef framework, every node that Chef manages has a locally installed agent called the chef-client. A client run is intended to bring the node to its desired state, as specified in a Chef “recipe.” You can track the number of Chef runs by aggregating successful and failed run events. The number of Chef runs should be fairly predictable, scaling with the number of nodes.
See your own Chef data in minutes with Datadog's out-of-the-box Chef dashboard.
Chef failures
This tracks each failed Chef run. If you see an increased error rate on your Chef run timeline, you can use individual failure events to dive in quickly and find more details about why the run failed.
Avg/worst execution time, past day(s)
The chef.resources.elapsed_time metric tracks the total time elapsed during a Chef run (in seconds). Tracking this metric over time helps reveal changes in average and worst-case execution times—the time it takes to cycle through all the steps in a Chef run. Wild swings in execution time may point to network issues.
Save time and effort by setting up Datadog’s Chef dashboard in minutes
If you’d like to start visualizing your Chef metrics in our out-of-the-box dashboard, you can try Datadog for free. The Chef dashboard will be populated immediately after you set up the Chef integration.
For more information on using Chef and Datadog, check out our Deploying and configuring Datadog with Chef Roles blog post.