Amazon Aurora dashboard overview
Amazon Aurora users can access high-level RDS metrics through Amazon CloudWatch as well as hundreds of metrics directly from the MySQL-compatible database engine. Ideally, both RDS and Aurora metrics should be collected for a comprehensive view. However, with so many metrics available, it can be difficult to decide which ones to focus on.
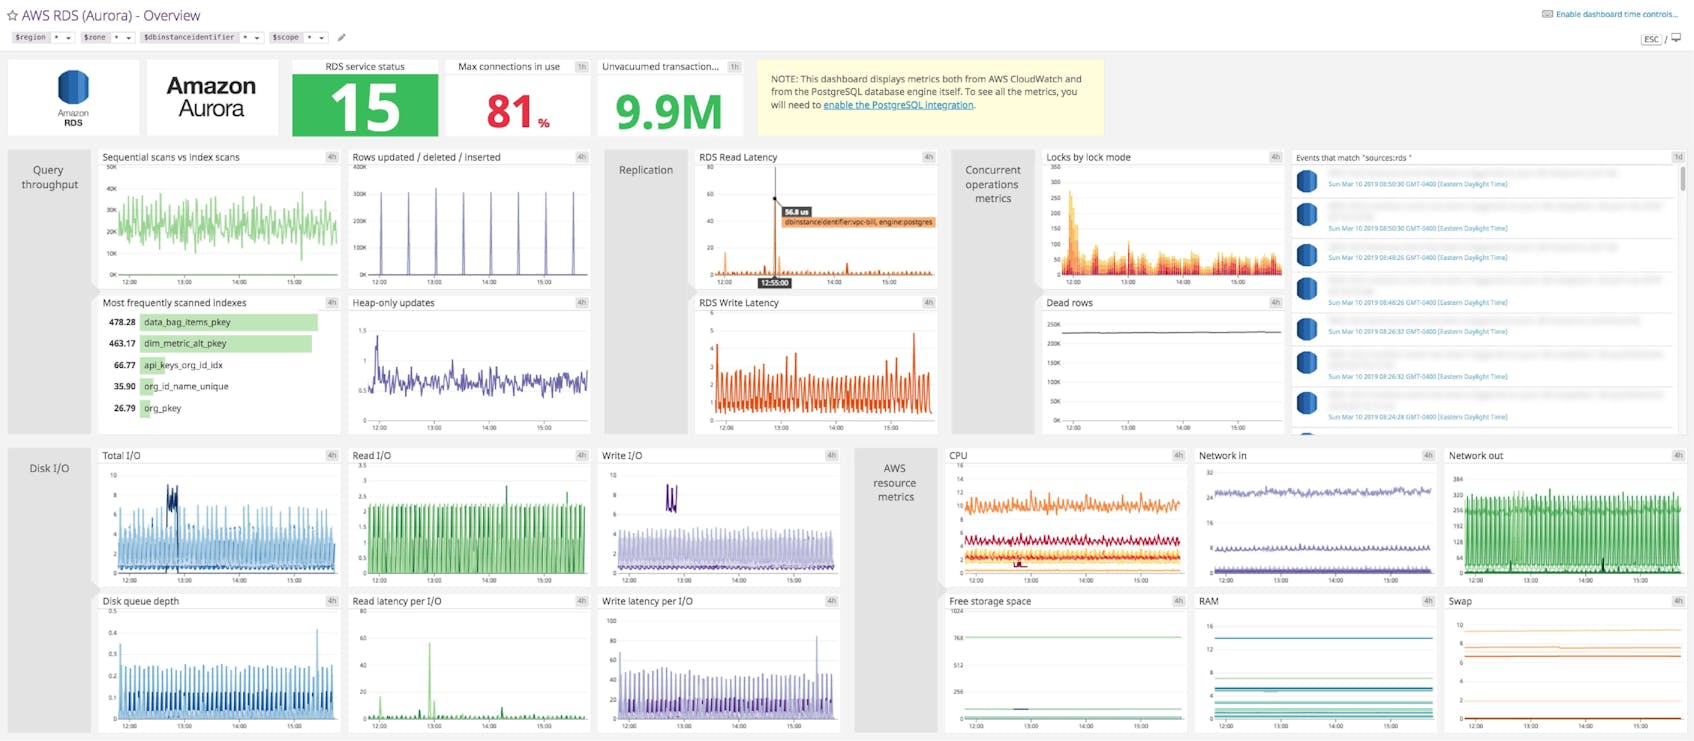
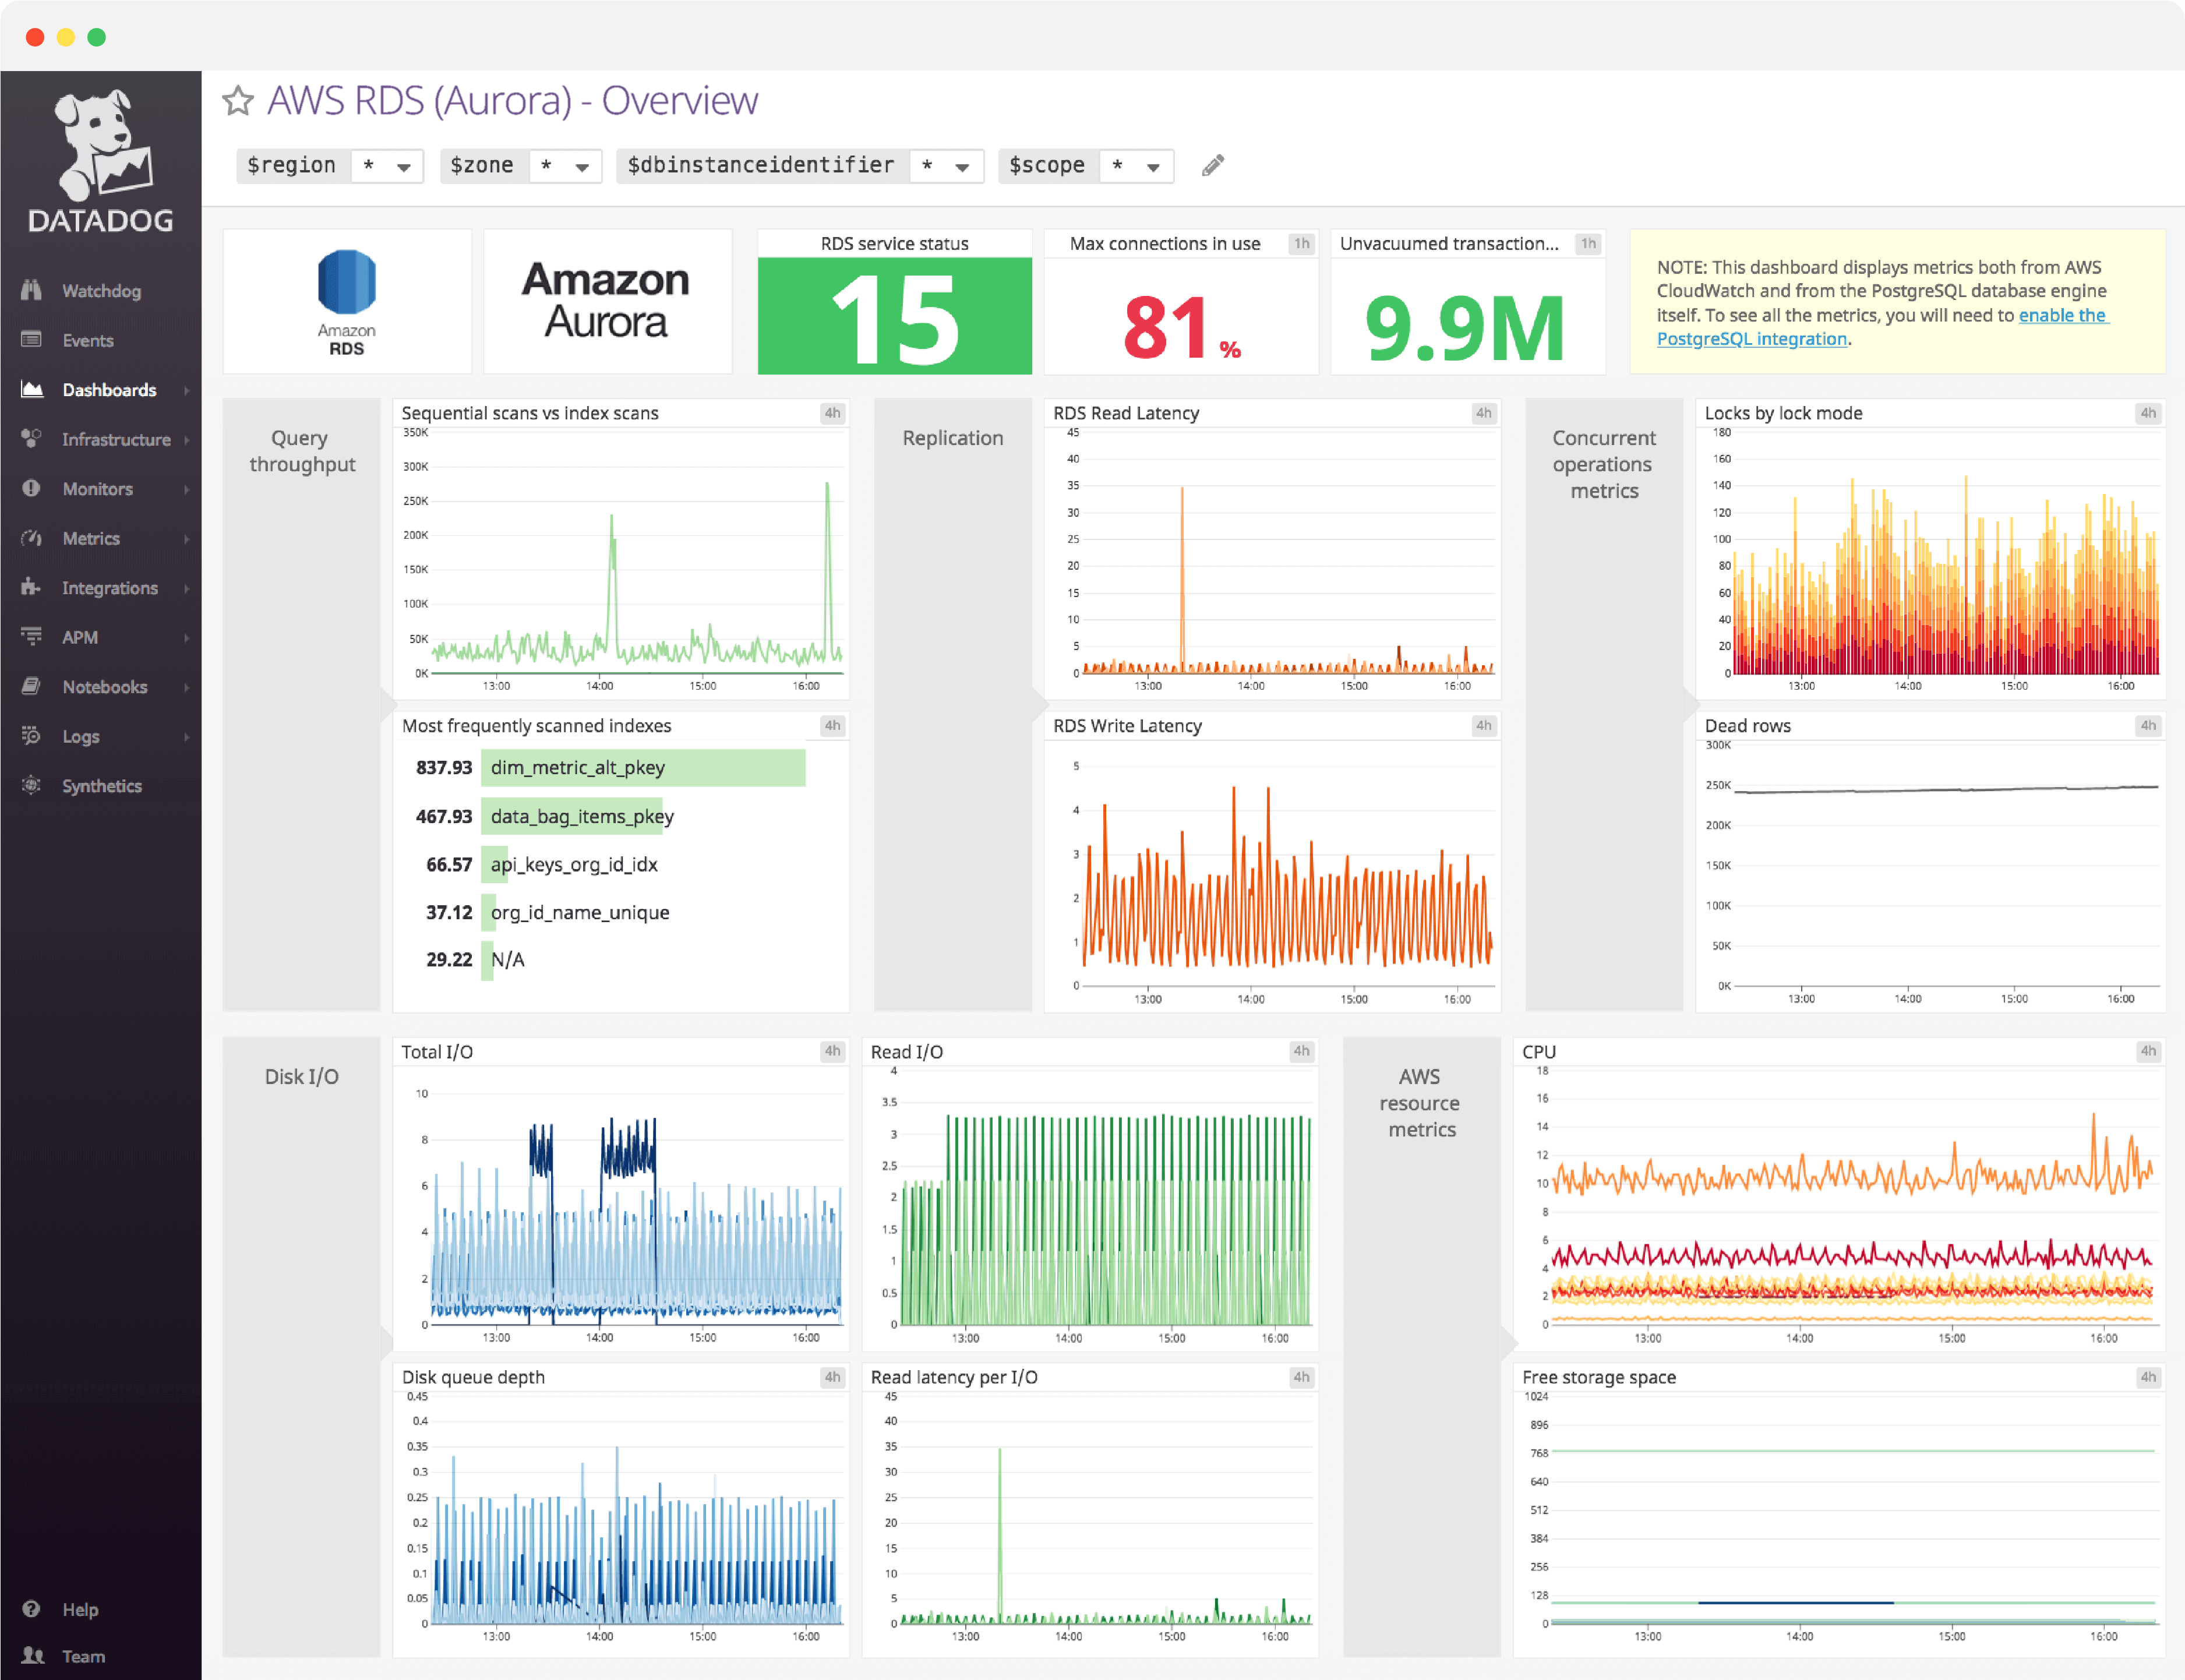
Datadog’s comprehensive Aurora dashboard displays important query volume, disk I/O, connection and replication, and AWS resource metrics in a single pane of glass. This page breaks down the metrics featured on that dashboard to provide a starting point for anyone looking to monitor Aurora performance.
What is Amazon Aurora?
Amazon Aurora is a MySQL-compatible database offered on the Relational Database Service (RDS). Aurora offers unique features such as auto-scaling storage, extremely low-latency replication, and rapid automated failover to a standby instance.
In comparison to the original MySQL database engine on RDS, Aurora introduces some performance enhancements and offers an expanded suite of monitoring metrics.
Set up real-time Amazon Aurora monitoring in minutes with Datadog's out-of-the-box dashboard.
Amazon Aurora dashboard metrics breakdown
Query volume metrics
Queries per second
This metrics help track the rise and fall of your query rate. It is important to alert on this metric because sudden changes in query volume, especially drastic drops in throughput, can indicate a problem.
SELECT queries per second
A CloudWatch metric that monitors the volume of SELECT statements. This metric corresponds to the reads served by the database engine.
DML (INSERT/UPDATE/DELETE) queries per second
The current rate of DML requests (inserts, updates, and deletes) that are rolled into the DMLThroughput metric. This metric corresponds to the writes served by the database engine.
Slow queries
This Aurora supported MySQL metric that increments every time a query’s execution time exceeds the number of seconds specified by the long_query_time parameter (configurable in the AWS console).
SELECT latency
This is the latency per read query—a metric unique to Aurora. Read latency, along with query volume, should be among the top metrics monitored for almost any use case.
DML (INSERT/UPDATE/DELETE) latency
This is the write query latency. It is important to alert on both read and write latency because any slow reads or writes will necessarily add latency to any application that relies on Aurora.
Disk I/O metrics
Total IOPS
CloudWatch makes available RDS metrics on read and write IOPS, which indicate how much your database is interacting with backing storage. This metric tracks the total number of I/O operations handled by the disk.
Read/Write IOPS
The ReadIOPS metric in CloudWatch provides the number of read I/O operations per second while the WriteIOPS metric provides the number of write I/O operations per second.
Disk queue depth
When storage volumes cannot keep pace with the volume of read and write requests, I/O operations begin queuing up. The DiskQueueDepth metric measures the length of this queue at any given moment.
Read latency per I/O
This RDS metric measures how long read I/O operations take at the disk level.
Write latency per I/O
This RDS metric measures how long write I/O operations take at the disk level.
Connection & replication metrics
Threads connected
The Threads_connected MySQL metric monitors the total number of open database connections. It is important to alert on this because if a client attempts to connect to Aurora when all available connections are in use, Aurora will refuse it and return a “Too many connections” error.
Threads running
This MySQL metric provides additional visibility for the Threads_connected metric by isolating the threads that are actively processing queries.
Replication lag
The AuroraReplicaLag metric is an Aurora-specific option for monitoring lag time for any read replica. This is different from the generic RDS ‘ReplicaLag’ metric because the AuroraReplicaLag metric tracks the lag in page cache updates from primary to replica rather than the lag in applying all write operations from the primary instance to the replica.
Set up real-time Amazon Aurora monitoring in minutes with Datadog's out-of-the-box dashboard.
AWS resource metrics
CPU
This metric tracks CPU utilization. High CPU utilization is not necessarily a bad sign, but the CPUs of your chosen instance type may be the bottleneck if IOPS and network metrics are in normal ranges and there appears to be sufficient memory.
Network in
The NetworkReceiveThroughput metric tracks network traffic sent from clients. Unlike other RDS database engines, Aurora’s network metric does not include network traffic from the database instances to the storage volumes.
Network out
The NetworkTransmitThroughput metric tracks network traffic being sent to clients. Unlike other RDS database engines, Aurora’s network metric does not include network traffic from the database instances to the storage volumes.
Save time and effort by setting up Datadog’s Amazon Aurora dashboard in minutes
If you’d like to start visualizing your Amazon Aurora metrics in our out-of-the-box dashboard, you can try Datadog for free. The Amazon Aurora dashboard will be populated immediately after you set up the integration.
For a deep dive on Amazon Aurora metrics and how to monitor them, check out our three-part Amazon Aurora monitoring series.