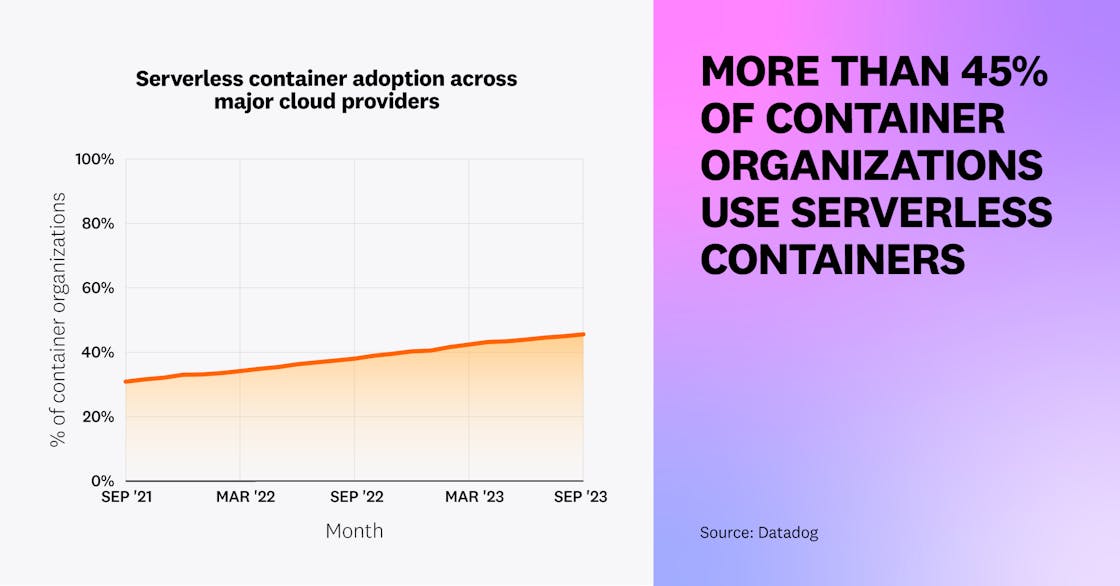
Adoption of serverless containers continues to increase
Serverless container adoption is on the rise—46 percent of container organizations now run serverless containers, up from 31 percent two years ago. We hypothesize that as organizations matured their container usage, many have adopted serverless containers as the next step in reducing operational overhead, increasing development agility, and lowering costs. Cloud providers fully provision and manage the infrastructure used by serverless containers, which enables teams to quickly launch new workloads while addressing the ongoing challenges of optimizing resource utilization.
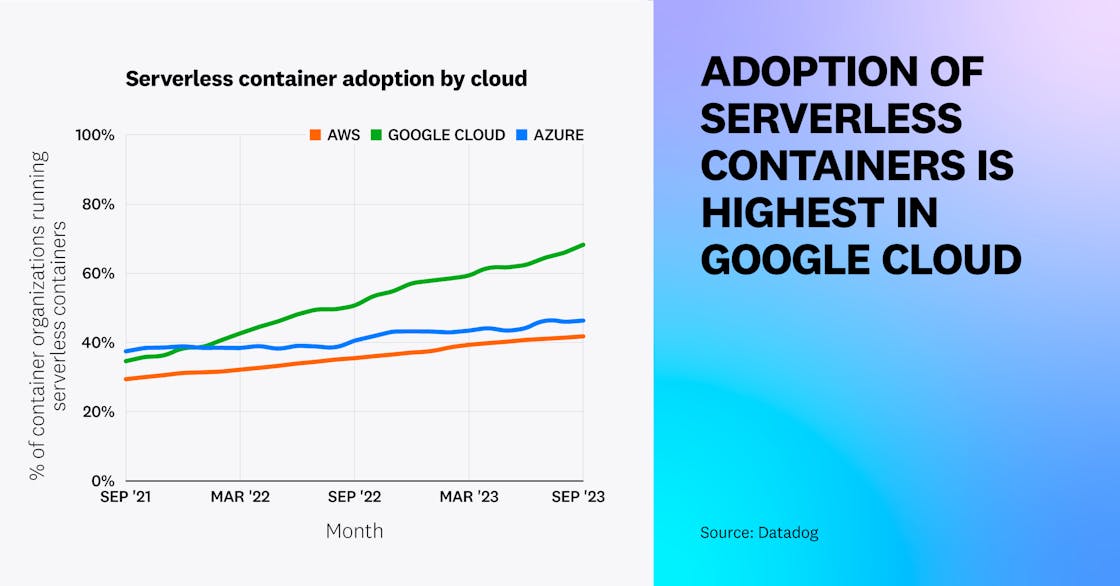
Serverless container adoption is growing across all major clouds, but Google Cloud leads the pack. In Google Cloud, 68 percent of container organizations now use serverless containers, up from 35 percent two years ago. This growth likely stems from the August 2022 release of the 2nd generation of Cloud Functions, which is built on top of Cloud Run. You can learn more about the growth of functions packaged as containers in this year’s serverless report.
Note: For the purpose of this fact:
- An organization is considered to be using serverless containers if it uses at least one of the following services: Amazon ECS Fargate, Amazon EKS Fargate, AWS App Runner, Google Kubernetes Engine Autopilot, Google Cloud Run, Azure Container Instances, and Azure Container Apps.
“Serverless container services, such as GKE Autopilot and Cloud Run from Google, allow teams to focus on building applications that align with core business needs, all while saving on costs and resources. GKE is the most scalable Kubernetes service available in the industry today, and it enables customers to leverage the cloud and containers to run AI-driven, business-critical applications that transform their businesses. GKE exposes Google’s key insights from nearly 20 years of running containers at scale to power products such as Search, Maps and YouTube. Google open-sourced Kubernetes in 2014 and leads the community with over 1 million contributions (and counting) to the project. Leveraging Google Cloud’s managed container platform results in better resource utilization, smarter cloud spend, and less operational overhead for customers.”
GM & VP, Cloud Runtimes, Google Cloud
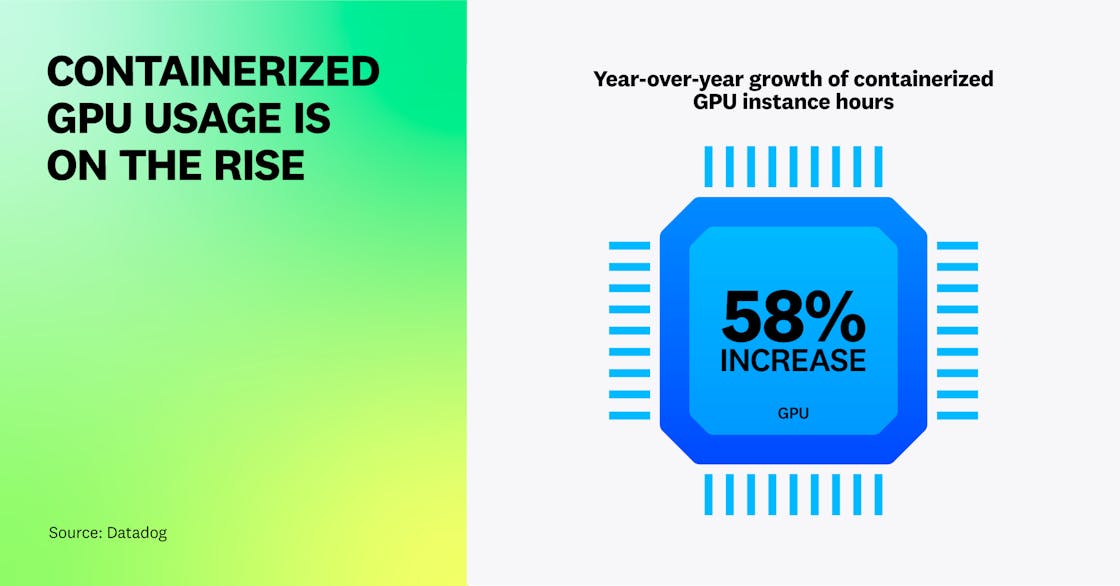
Usage of GPU-based compute on containerized workloads has increased
GPUs were traditionally used to power compute-intensive applications such as computer graphics and animation, but this data processing hardware is also now used to efficiently train ML and large language models (LLMs), perform inferences, and process large datasets. When researching the growth of these workloads, we observed a 58 percent year-over-year increase in the compute time used by containerized GPU-based instances (compared to a 25 percent increase in non-containerized GPU-based compute time over the same time period).
We believe that growth in GPU-based compute on containers is outpacing its non-containerized counterpart because of the scale of data processing required for AI/ML workloads. LLMs and other ML models need to be trained on hundreds of terabytes of unstructured data, a process that is exponentially more compute-intensive than the typical data-processing requirements of traditional web service workloads. As more GPU-based compute options become available, customers can also use containers to migrate their workloads from one cloud provider to another in order to unlock better cost benefits.
To kick-start their AI/ML workflows, teams can use prepackaged container images, such as AWS Deep Learning Containers—or they can adopt a managed Kubernetes service that enables them to allocate GPUs to their containerized workloads. We believe that, as investment in next-generation AI-based applications expands and the amount of unstructured data required for their models grows, organizations will increasingly run GPU-based workloads on containers to improve their development agility and better harvest insights from their data.
“GPUs’ rise in popularity was heralded by its applications in gaming, graphics rendering, and other complex data processing tasks. Now, with the surge of AI/ML-based applications in development, it’s no surprise that Datadog is reporting a significant increase in customers’ GPU-based compute usage within containerized workloads. At OctoML, we’ve witnessed a massive uptick in GPU-compute consumption driven by the adoption of AI over the last 12 months. Our customers run millions of AI inference calls daily through our platform, OctoAI, and the rate of growth is rapidly accelerating.”
Chief Product Officer, OctoML
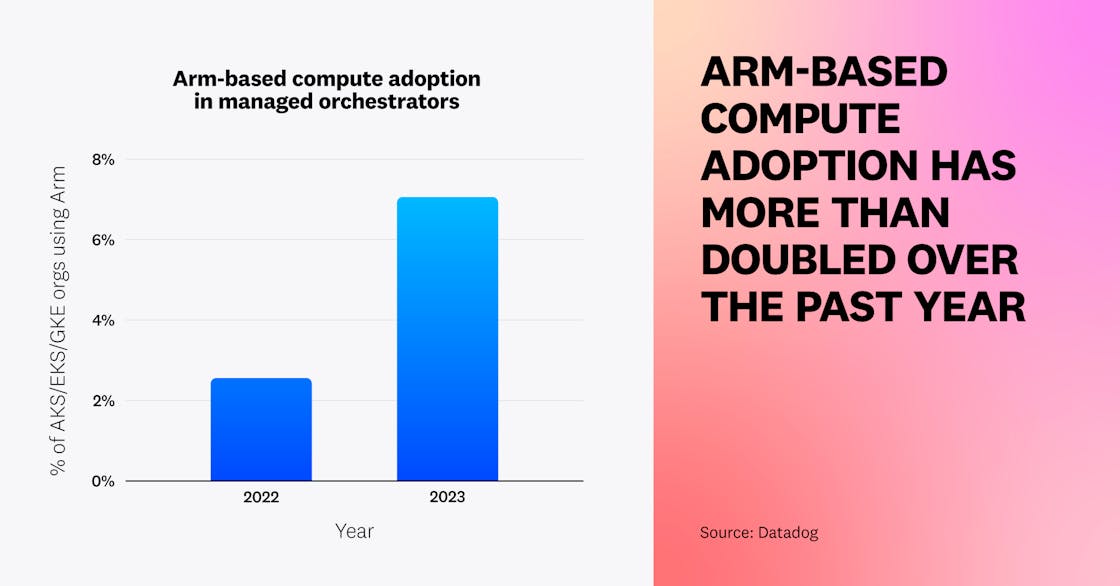
Adoption of Arm-based compute instances for containerized workloads has more than doubled
Container-optimized Arm-based instances can reduce costs by 20 percent compared to x86-based instances, due to their lower energy consumption and heat production. We’ve seen this work ourselves at Datadog, where many of our engineering teams have been successful at reducing cloud spend without sacrificing application performance. We speculate that other organizations have experienced similar success with their containerized workloads—adoption of Arm-based compute instances among organizations using managed Kubernetes services has more than doubled from 2.6 percent to 7.1 percent over the past year. We expect to see more organizations migrating to Arm to leverage cost benefits, though adoption may be hindered by the need to refactor applications to ensure that the programming languages, libraries, and frameworks they use are compatible.
“At Datadog, teams migrated many Intel CPU-compatible workloads to Arm-based compute to deliver equivalent performance and more features at a better price point. To accomplish this, we broke down our workloads by size and performance requirements, prioritized providing an effective central build infrastructure, and took advantage of major version upgrades and planned migrations as opportunities to drive Arm adoption.”
VP of Engineering, Infrastructure and Reliability, Datadog
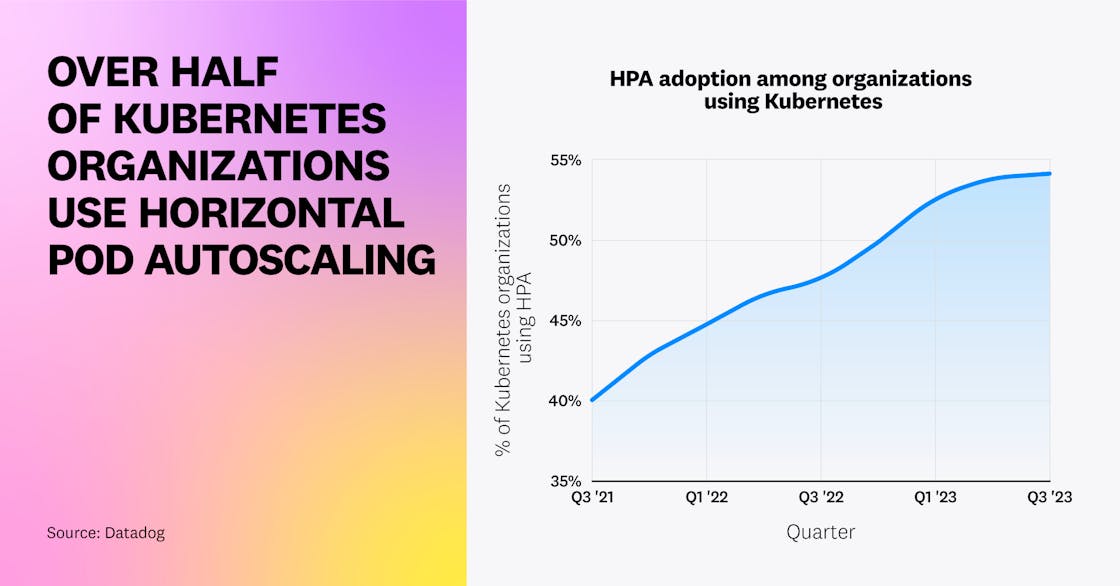
Over half of Kubernetes organizations have adopted Horizontal Pod Autoscaling
One main benefit of cloud computing is elasticity—the ability to scale infrastructure to accommodate fluctuating demand. Within Kubernetes, one way this is supported is via Horizontal Pod Autoscaling (HPA), which automatically deploys pods or scales them back depending on the current load. This enables organizations to maintain a smooth user experience and app performance during surges in traffic and reduce infrastructure costs during periods of low activity by automatically adjusting the number of running pods.
We previously noted that HPA was growing in popularity among Kubernetes organizations—and that trend has continued to this day. Now, over half of Kubernetes organizations are using HPA to scale their workloads.
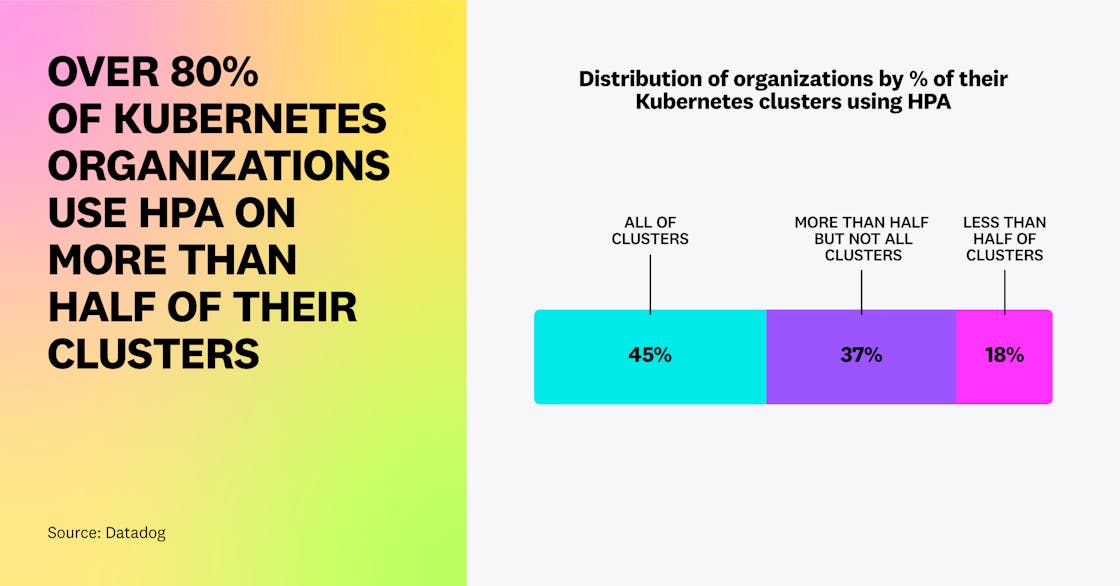
Once organizations adopt HPA, they don’t just use it on a small subset of their environment—over 80 percent of these organizations have enabled this feature on at least half of their clusters, and 45 percent have enabled it everywhere.
We believe that HPA’s popularity is due to the fact that Kubernetes has released significant enhancements to the feature over time. When HPA was introduced, it only allowed users to autoscale pods off of basic metrics like CPU, but with the release of v1.10, it added support for external metrics. As the Kubernetes community continues to enrich HPA capabilities, many organizations are adopting new releases earlier to fine-tune their autoscaling strategy. For example, HPA now supports the ContainerResource type metric (introduced as a beta feature in v1.27), which allows users to scale workloads more granularly based on the resource usage of key containers, instead of entire pods.
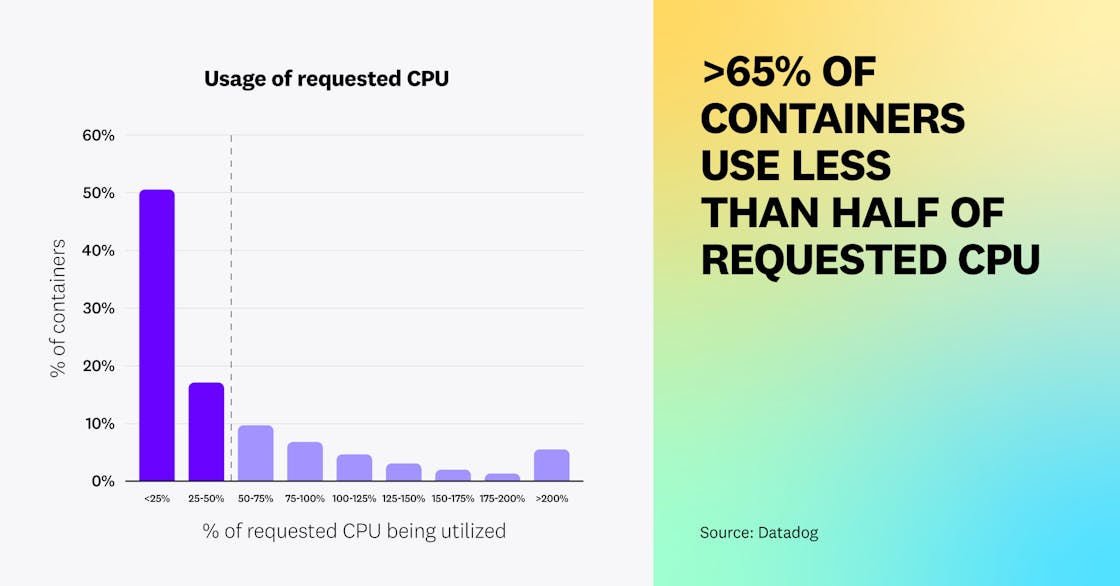
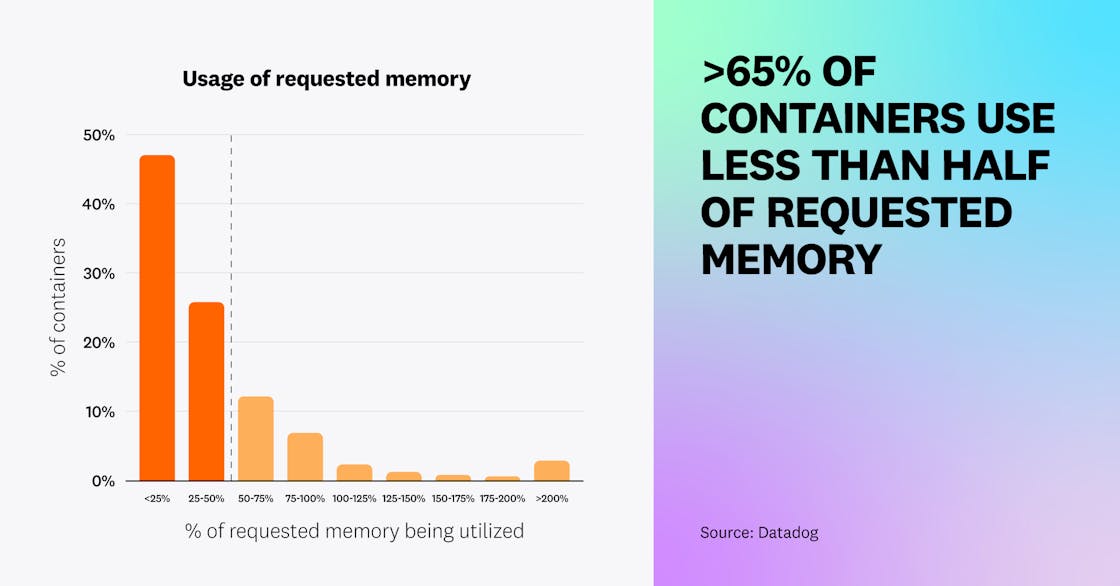
The majority of Kubernetes workloads are underutilizing resources
Kubernetes users can specify requests to ensure that containers will have access to a minimum amount of resources. But our data shows that these requests are often higher than needed; over 65 percent of Kubernetes workloads are utilizing less than half of their requested CPU and memory—a testament to how challenging it can be to rightsize workloads. Customers have told us that they will often choose to overprovision resources for their containers, despite the additional costs, as a way to avoid infrastructure capacity issues from impacting their end users. Based on our data, we still see plenty of room for organizations to optimize resource utilization and reduce infrastructure costs.
We believe that organizations are running into these challenges due to a lack of compatible or available cost optimization tools. The Vertical Pod Autoscaler (VPA) is a Kubernetes feature that recommends containers’ CPU and memory requests and limits based on their past resource usage. However, we found that less than 1 percent of Kubernetes organizations use VPA—and this number has remained flat since we last looked at VPA adoption in 2021. We suspect that VPA’s low adoption rate may be due to the fact that this feature is still in beta and has certain limitations. For example, it is not recommended for use alongside HPA on CPU and memory metrics, and over half of organizations are now using HPA. As organizations look to further reduce their cloud bill and more cost optimization solutions become available, we expect to see increased adoption of tools such as Kubernetes Resource Utilization that make it easier to identify workloads that are using resources inefficiently and optimize their usage.
Databases and web servers are the leading workload categories for containers
In our previous research, we analyzed the most popular container images, but this year we categorized these technologies to provide aggregate trends in container use. Our data shows that databases and web servers are the most popular workloads among organizations today. Containers have long been a popular way to run stateless web and batch applications—but customers have since evolved their container use to confidently run stateful applications. Over 41 percent of container organizations are now hosting databases on containers. This reinforces our prior data, which found that Redis and Postgres have consistently ranked at the top of the list of most popular container images.
Over the years, the container ecosystem has matured to meet the needs of organizations looking to deploy stateful applications on containers. With the release of StatefulSets in Kubernetes v1.9, organizations were able to persist data upon the relaunch of pods, and additional features such as volume snapshots and dynamic volume provisioning enabled them to back up their data and remove the need to pre-provision storage. Cloud providers such as AWS now provide built-in support for running stateful workloads on containers—including serverless services like EKS on Fargate—while open source tools like K8ssandra also make it easier to deploy databases in Kubernetes environments.
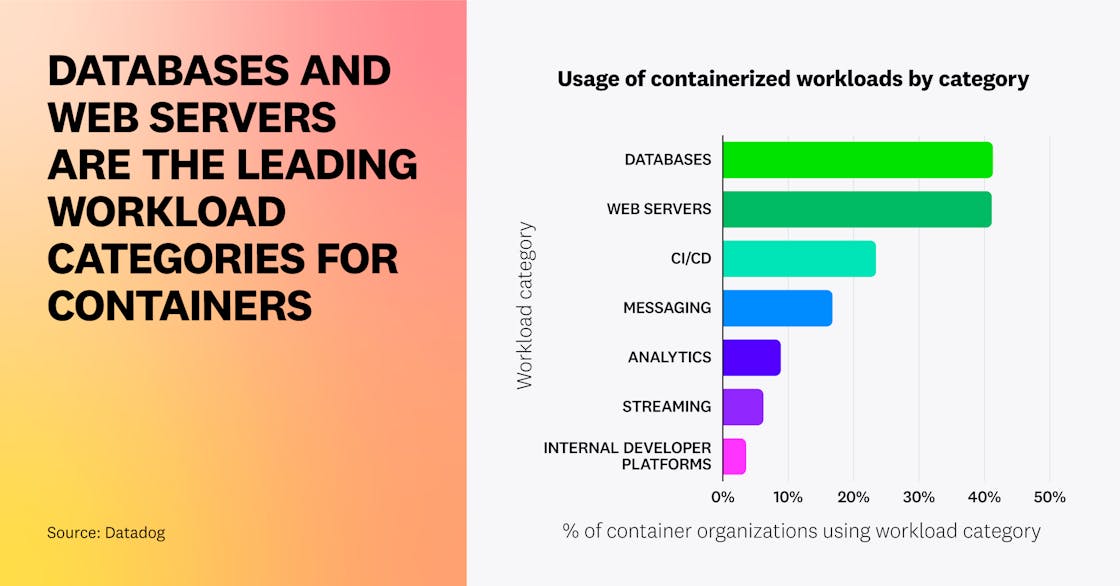
Note: For the purpose of this fact, the categories visualized are defined as follows:
- Databases: Redis, MySQL, and others
- Web Servers: NGINX, OpenResty, and others
- CI/CD: Jenkins, Argo CD, and others
- Messaging: Kafka, RabbitMQ, and others
- Analytics: Hadoop, Elasticsearch, and others
- Streaming: Spark, Flink, and others
- Internal Developer Platforms: Crossplane, Garden, and others
“From its early days of supporting stateless workloads, Kubernetes has advanced to supporting data-centric workloads. Powered by the need to create business advantage from real-time data and the scalability and resiliency benefits provided by Kubernetes, many companies are now using containerized infrastructure for their stateful workloads. Databases sit at the top of the list of workloads running on Kubernetes, and with the capabilities being built by the Kubernetes community and the work that the Data On Kubernetes Community (DoKC) is doing, we anticipate that more end users will embrace Kubernetes to host data workloads.”
Managing Director, Data on Kubernetes Community
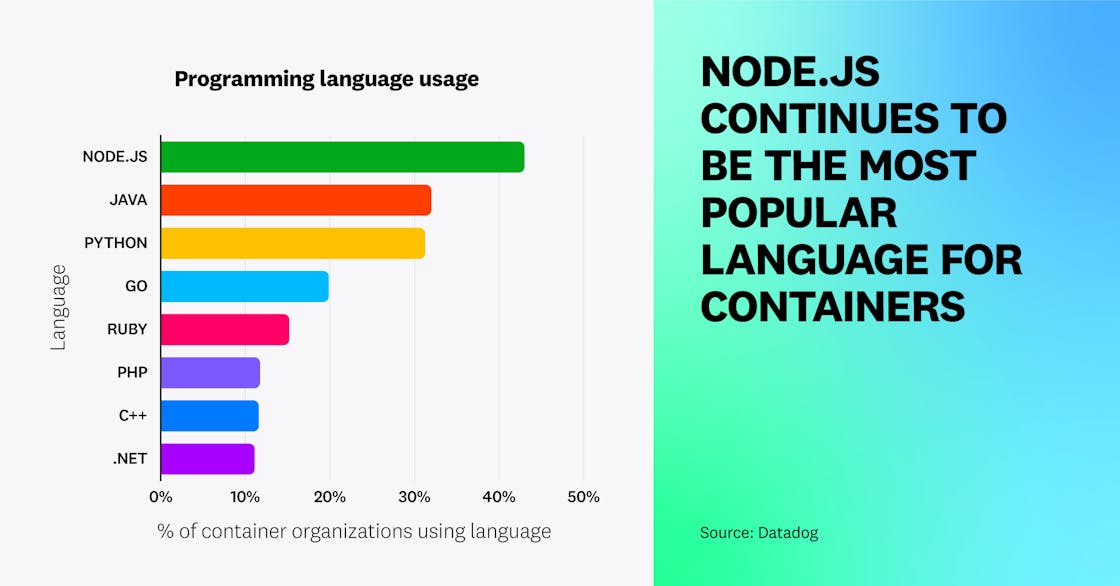
Node.js continues to be the leading language for containers
Node.js has continued to lead as the most popular programming language for containers, followed by Java and Python—a trend that aligns with the last time we analyzed this data in 2019. Applications built on Node.js are lightweight and scalable, making them a natural choice for packaging and deploying as containers. The fourth most popular language has changed from PHP to Go, which serves as a testament to Go’s simplicity, scalability, and speed for developing cloud-native applications. The percentage of organizations using C++ on containers has also increased as cloud providers now offer better build tooling, libraries, and debugging support. (Note that the percentages add up to more than 100 percent because each organization may use several languages.)
Java claims a large market share of enterprise applications and continues to be the most popular language in non-containerized environments. Based on our conversations with customers, many of them have begun (or are in the process of) migrating their Java-based legacy applications to run on containers. We expect to see future growth of Java usage in container environments, driven by the modernization of enterprise applications and the development of container-focused features (such as OpenJDK’s container awareness).
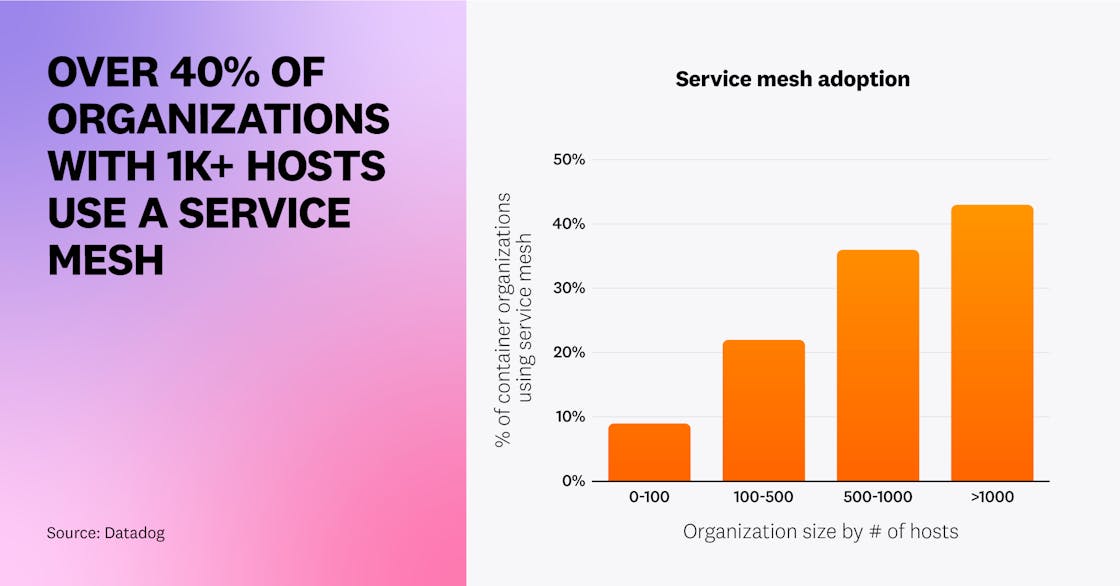
Organizations with larger container environments are using a service mesh
In 2020, we noted that organizations were just beginning to use service mesh technologies like Envoy and NGINX. This year, we expanded our research to include a broader set of technologies, including Istio, Linkerd, and Traefik Mesh, to get an even more comprehensive view of where service mesh adoption stands today. We observed that the likelihood of running a service mesh increases along with the size of an organization’s host footprint—over 40 percent of organizations running more than 1,000 hosts are using a service mesh.
One reason why service meshes are more popular in large environments is likely because they help organizations address the challenges of managing services’ communication pathways, security, and observability at scale. Service meshes provide built-in solutions that reduce the complexity of implementing features like mutual TLS, load balancing, and cross-cluster communication. We believe that, as more organizations migrate existing services to containers and expand their node footprint, service meshes will continue to gain traction, particularly in large-scale deployments.
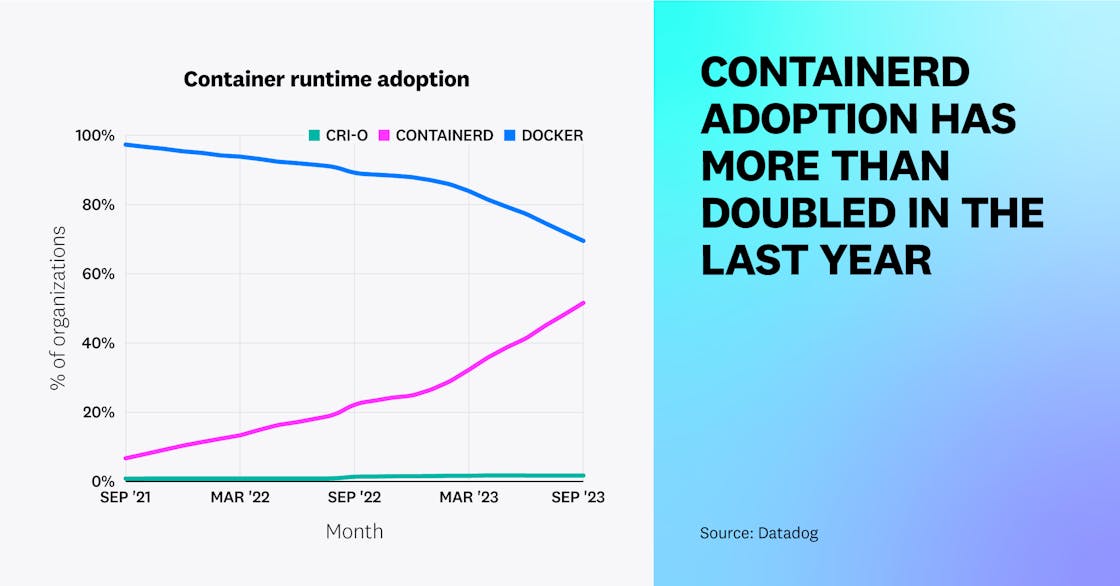
Containerd has continued to replace Docker as a predominant container runtime
In 2021, we reported that containerd runtime adoption was on the rise following the deprecation of dockershim in Kubernetes. Over the past year, we have seen containerd adoption more than double. Fifty-three percent of container organizations currently use containerd, compared to just 23 percent a year ago and 8 percent two years ago. Meanwhile, CRI-O adoption has experienced less growth in comparison. As more organizations have migrated to newer versions of Kubernetes that no longer support dockershim, we have seen a decline in the usage of Docker, which fell from 88 percent to 65 percent over the past year. (Note that the percentages add up to more than 100 percent because each organization may use more than one container runtime.)
Though Docker support has been deprecated since Kubernetes v1.24, teams that aren’t ready to migrate to a new runtime can still use Docker via the cri-dockerd adapter, which likely explains the runtime’s high usage rate. However, as more teams upgrade to newer versions of Kubernetes and roadmap their environments with future support in mind, we expect containerd to overtake Docker as the predominant runtime.
“Since the Kubernetes project evolved its built-in support for Docker by removing dockershim in Kubernetes release v1.24, it was only a matter of time before we saw a rise in more container deployments with containerd. The containerd runtime is lightweight in nature and strongly supported by the open source community. Containerd evolved out of the Docker engine and is now one of the top graduated projects at CNCF, used by most hyperscalers for their managed Kubernetes offerings.”
CTO, Cloud Native Computing Foundation
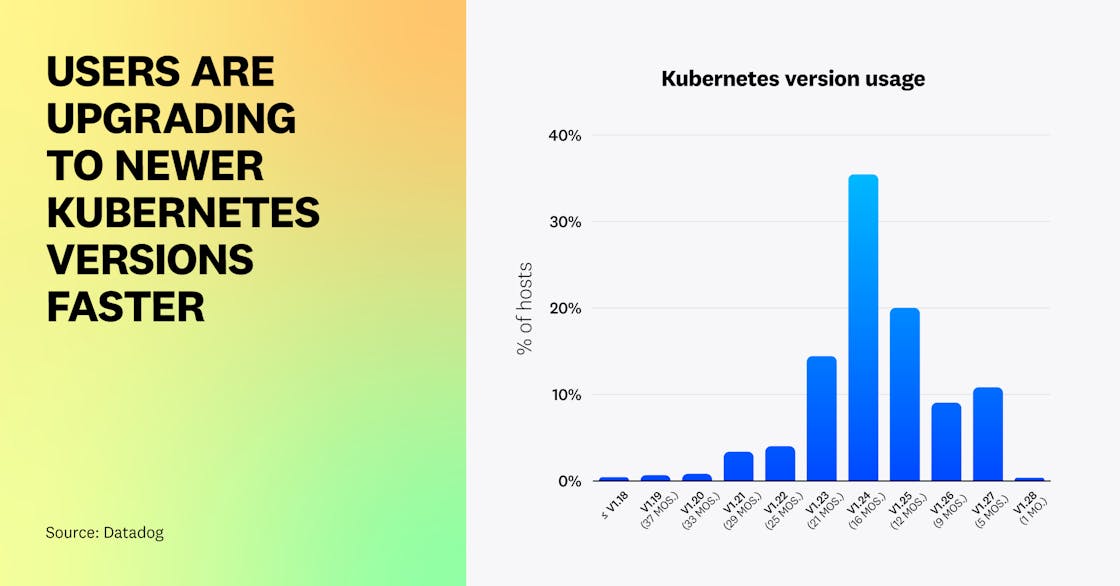
Users are upgrading to newer Kubernetes releases earlier than before
Each year, Kubernetes releases three new versions to fix bugs, address security issues, and improve the end-user experience. Last year, we observed that most users were slow to adopt new releases, which gives them time to test the stability of each version and ensure that it is compatible with their workloads.
Today, Kubernetes v1.24 (16 months old at the time of writing) is the most popular release, which aligns with historical trends. However, this year, we’ve seen a marked increase in the adoption of newer versions of Kubernetes. Forty percent of Kubernetes organizations are using versions (v1.25+) that are approximately a year old or less—a significant improvement compared to 5 percent a year ago.
We’ve heard from customers that many are upgrading to newer releases earlier to gain access to features such as Service Internal Traffic Policy (released in v1.26) and the ability to configure Horizontal Pod Autoscaling based on individual containers’ resource usage (released in beta in v1.27). These features give users more granular control over their clusters, which can help reduce operating costs. Managed Kubernetes services also play a role in helping users upgrade their clusters more quickly (e.g., by default, GKE Autopilot automatically upgrades clusters to the latest Kubernetes version a few months after it has been released). We expect the adoption of Kubernetes releases to continue to shift left as more organizations adopt managed services like Autopilot and upgrade their workloads to take advantage of new Kubernetes feature states. One way they can do this safely is by upgrading non-mission critical workloads prior to deploying new releases more widely across production environments.