Measuring platform modernization success with real user experience data
Shinsegae International launched S.I Village in 2016 and rebranded it as Shinsegae V in 2025. Since then, it has grown into a leading e-commerce platform. As the platform continued to expand, the company undertook a large-scale system redesign to modernize its architecture. This initiative focused on separating and restructuring its complex, tightly interconnected monolithic system into distributed, cloud-based microservices, with the goal of delivering greater value and improved customer experiences.
Throughout this transformation, the team was committed to ensuring that their modernization efforts delivered meaningful improvements to customer experience. While the project was led by a lean team of 40 developers, engineers, and planners, they remained focused on maintaining real-time visibility into the user experience. Even with limited resources, securing real-time observability was essential.
To operationalize this visibility, the team defined four guiding principles for how Datadog RUM dashboards would be designed and used across the platform.
Four principles for building monitoring dashboards
First, they adopted a user-centric approach, prioritizing an understanding of user behavior and focusing on scenarios and deployments that directly serve customers.
Second, they linked service and product metrics with engineering and technical metrics. User and service indicators needed to be designed in a way that developers and engineers could realistically apply within dashboards.
Third, they included only actionable signal metrics. Every metric on the dashboard had to drive meaningful action.
Finally, dashboards and metrics were designed to continuously evolve alongside platform and service changes. Like software, dashboards would be regularly reviewed and refined to adapt to new conditions.
These principles were established not only to improve platform and service visibility, but also to create a scalable operational model for future growth. As the platform expanded, the team needed monitoring systems that could evolve efficiently alongside the business—without increasing operational overhead or slowing feature development.
That scalability became increasingly important as Shinsegae V experienced rapid growth. By April 2024, the number of SKUs had grown more than 50x and the number of brands more than 30x, significantly increasing operational complexity while resources remained lean. To keep pace with this growth, the team focused on building systems and dashboards that could scale efficiently with minimal maintenance and as few lines of code as possible.
Building visualization dashboards in days with just a few lines of code
The implementation process was straightforward. With just a few lines of script code, the team was able to visualize service information and system components in a way that was easy for everyone to understand.
They defined key metrics tailored to each domain and microservice to monitor customer experience. Data that had previously existed only in code, such as promotions, event titles, product names, categories, order and payment details, and return status, was translated into clear, natural-language dashboards. Within just 3 to 4 days, dashboards covering all domains and services were live.
Rather than filling dashboards with unnecessary data, Shinsegae International focused on selecting metrics that were meaningful and actionable for each domain, guided by its core principles and the specific service and technical characteristics of that domain.
In the product domain, which includes product listings and related pages, this meant concentrating on page load performance, user interactions, and product data classification. These user-facing indicators were supported by engineering metrics to provide deeper visibility into system performance.
The order domain, however, required a different level of monitoring. Responsible for checkout, payment, and order processing, it involves numerous internal and external integrations, complex business logic, and sensitive data handling. As a result, it required the largest and most comprehensive dashboard. Close monitoring of integrations with payment gateways, products and promotions, membership systems, and address data was essential to ensuring stable operations.
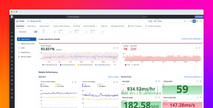
The dashboards were organized in a tree-like structure to provide both high-level visibility and detailed insights. A central “Trunk Dashboard” offers an overview of the entire platform, while “Branch Dashboards” provide domain- and service-level monitoring. This structure allows teams to quickly understand overall platform health while drilling down into specific services as needed. As new services and features are added or modified, the dashboards evolve accordingly.
92% Reduction in Mean Time to Detection
With frontend observability visualizations built on Datadog RUM, the team identified and resolved issues that previously went unnoticed. They gained visibility into script errors, abnormal pages, transaction delays, slow page loads, and other anomalies that affected user experience. Previously, these issues were often discovered only through customer service complaints.
The Session Replay feature enabled the team to identify unusual cases, such as bot traffic or malicious users, that were difficult to detect during development or testing. It also significantly reduced the time required to reproduce issues reported by customer support.
As a result, proactive issue identification and rapid response became possible. Mean Time to Detection was reduced by 92%, allowing issues to be identified within minutes. Customer service inquiries related to system issues also decreased significantly.
Beyond Service Stability: Expanding Communication and Collaboration
The impact of implementing Datadog RUM extended beyond improvements in service quality and stability. Developers and engineers became more mindful of how deployments affect customer experience, made more data-driven decisions, and evolved into a more proactive team.
The gap between technical and business teams narrowed as visibility and data improved. By visualizing the business impact of technical investments through measurable indicators, communication strengthened with both business departments and executives. Collaboration also expanded across strategy, marketing, and design teams.
Datadog RUM Heatmaps, including Scroll Maps, enabled the team to analyze where users stopped scrolling, which product content retained attention, and where users dropped off. Originally introduced to monitor platform performance and user experience, the observability platform now also supports marketing performance analysis and user-centric platform strategy development.
Through RUM-driven customer behavior data, Shinsegae International identified two key insights. Users frequently engage in exploratory behavior to browse content, promotions, and campaigns, or begin their journey from personalized touchpoints. Viewing liked content or returning to items saved in the shopping cart represented the highest levels of engagement. These key insights now help shape the platform’s strategic direction.
“With just a few lines of code, we set out to visualize frontend metrics and user behavior. While our goal was to understand user experience through an MVP (Minimum Viable Product), we ultimately narrowed the gap between technology and business. Our tech team has become more data-driven, weighing the impact of deployments and prioritizing customer experience. We expect this growth, combined with the Shinsegae V platform transformation, to create strong synergy and deliver more personalized experiences to users.”
Additionally, Shinsegae International uses more than 12 marketing solutions, including Appsflyer and Google Analytics, to generate reports on platform events and campaigns for executive leadership. The team has established processes to quickly detect and communicate report data errors in a rapidly changing service environment. RUM enables real-time traffic visualization and tracking by channel without additional coding or tagging, allowing efficient maintenance and management.
The Next Phase: End-to-End Monitoring and Personalized Experiences
The journey to modernize Shinsegae V and enhance service visibility continues. One remaining challenge is consolidating siloed monitoring tools across application performance management, databases, and infrastructure into a unified end-to-end monitoring system.
The team also plans to refine sampling rate strategies and standardize logs across applications using Datadog Log Management. Beyond delivering data-driven services, Shinsegae V aims to experiment with innovative technologies, including Model Context Protocol and AI, to provide more personalized e-commerce experiences.