
In order to grow your organization effectively, you need to ensure the scalability of your systems. In a broad, distributed architecture, critical processes like incident triage, security response, and large-scale configuration changes can be difficult to execute without a programmatically accessible registry of what’s running in production and who owns it.
By creating a service catalog that enriches services with ownership and configuration metadata, maps dependencies, and collates monitoring data, you can maintain a central source of knowledge about your services’ health, activity, security posture, and more. However, service catalogs are not one-size-fits-all, and there are many things to consider when building and maintaining your catalog as the data changes and your teams spin up new services.
In this post, we’ll discuss strategies and best practices for building, maintaining, and leveraging your service catalog to optimize your incident response strategy, promote service ownership standards, and manage large-scale engineering projects that pay off technical debt. Along the way, we’ll look at how Datadog Service Catalog supports these practices at every stage.
Primer on service catalogs
Service catalogs are a key component of your organization’s internal development resources. They provide platform administrators, service owners, DevOps personnel, and other stakeholders with a “one-stop shop” for insights about how teams are running their services. By extensively documenting and centralizing knowledge about your services, a service catalog can help you implement fine-grained access control, audit service health, find observability gaps, and plan upgrades—without running into snags where team members can’t access the information they need and don’t know who to call.
Service catalogs are populated by using a registry of service definitions, which include a standardized set of information about each service, such as the associated team, owner, code location, on-call engineer, and contact channels. Your catalog can also include assets like scorecards, SLOs, dashboards, and monitors, all of which can help characterize your services’ health and performance at a glance. Service catalogs can also include or reference monitoring data for context around test coverage, security posture, cost attribution, and other service health indicators.
By building a service catalog, you can more effectively manage your organization’s observability strategy. How you build the catalog depends on the details of this strategy, which may involve different stages depending on your organization’s maturity, the criticality of each of your services, and the compliance standards your organization has to follow. You must determine how to discover services and maintain service definitions, establish standards for these definitions, and ensure that teams are meeting them. You must also establish processes for maintaining your catalog to preserve data consistency as new services and their related attributes come into play (including docs, runbooks, dashboards, and so on). And to make your service catalog more useful, you should also consider how to integrate or reference relevant monitoring data in your service catalog entries.
With these requirements in mind, we’ll next discuss how and why you should:
- Create and maintain your catalog with accurate service definitions
- Enrich your catalog with metadata and telemetry from your monitoring stack
- Use your catalog to enforce service ownership standards, streamline incident response, and provide context for inter-service projects
Create and maintain accurate service definitions
When setting up your service catalog, the first step is to establish your service definitions, registering your services alongside the metadata and telemetry that your personnel can use to learn about them. Depending on your monitoring system and service catalog solution, you may be able to discover services automatically, or you may have to manually declare them. But regardless of which service discovery methods you use, you should form a reliable process so that service owners and other stakeholders can easily create and maintain their service definitions. This will help ensure that your data remains consistent and accurate as details about your services change and new services are added.
Next, we’ll discuss best practices for service discovery as well as best practices for maintaining your catalog’s service definitions.
Discover services to establish definitions
By forming a reliable process to declare services, you can ensure that your catalog remains complete and accurate. Even if your teams aren’t collecting live traces or other kinds of telemetry from their services, you can still form your service definitions manually by updating a central configuration file. The definitions in this file will include all the metadata that the catalog will use to file your services.
You should integrate this process into your control plane to make it easier for different stakeholders to declare and update service definitions. To facilitate this, you can create and update the registry file programmatically or via a configuration management service like Terraform. You should include this file in your version control and ensure that it’s updated whenever new resources are added to your environment. You should also use any existing knowledge sources your organization maintains, such as CMDB tables and spreadsheets, to populate your service definitions.
Datadog Service Catalog supports these strategies by letting you manually declare services as entries in the service.datadog.yaml registry. You can also post updates to this file via our API or the Datadog Terraform module. For example, the following file declares the ad-server service along with team ownership, source code, and documentation links, as well as channels for contacting the on-call service owner.
---
schema-version: v2.2
dd-service: ad-server
team: ads
contacts:
  - type: slack
    contact: https://datadogincidents.slack.com/archives/C01EWN6319S
links:
  - name: Source
    provider: github
    url: https://github.com/DataDog/shopist/tree/prod/ad-server
    type: repo
  - name: Deployment
    provider: github
    url: https://github.com/DataDog/shopist/blob/prod/k8s/ad-server/templates/ad-server-deployment.yaml
    type: repo
  - name: Datadog Doc
    provider: link
    url: https://docs.datadoghq.com/
    type: doc
tags:
  - "app:web-ads"
  - "tier:1"
  - "business-unit:marketing"
integrations:
  pagerduty:
    service-url: https://datadog.pagerduty.com/service-directory/PXZNFXP
Service Catalog supports integrations with ServiceNow and Backstage, enabling you to import knowledge bases stored either in ServiceNow CI tables or in Backstage’s catalog-info.yaml file and map them to related telemetry and metadata from Datadog. Service Catalog also takes service discovery a step further by automatically detecting services based on Universal Service Monitoring (USM) and APM traces.
The integration with APM enables Datadog to routinely discover new services and their metadata with the same frequency that your traces are collected. And with USM, the Datadog Agent instruments your eBPF-compatible services using kernel code to enable better application performance and minimize overhead in your application code. If you’re already using APM, or if your environment is already USM-compatible, it’s wise to use this auto-discovery as much as possible so that your catalog remains updated continuously, and to reduce developer overhead.
Use scheduled updates to keep your catalog complete
As your current services mature and new ones are added, you must keep your catalog schema updated consistently so that the catalog remains effective. Depending on the size and structure of your org, the maintenance of the catalog will fall in the hands of different teams and stakeholders. If there isn’t a central DevOps team that can govern the whole catalog on its own, each team must manage their own service via a GitOps-style update procedure.
As we discussed previously, the service definition registry file should live within your teams’ version control, and ideally next to other essential observability configurations (e.g., your Datadog Helm chart). This makes it easier to reference new deployments and other changes to the services for which an update to the service registry may be required.
By configuring a GitHub Action, you can also automate this management of your service metadata. This is a best practice because it also enables you to apply organizational controls, such as requiring all of your production services to have valid runbook links. With these gates in place within your version control, you can ensure that teams are declaring services in a way that meets your standards and makes them easy to find using queries.
In a larger organization, or one with an existing registry of ownership (an internal system such as Backstage, or even a spreadsheet), a central team can schedule updates to the service metadata using API calls. Since only that team will have write access to the service definitions, this cuts down on unintended or misformatted changes.
Connect metadata and telemetry from your monitoring stack
Regardless of how you’re handling service discovery, you can enrich your service definitions with additional context. Next, we’ll discuss a few different kinds of metadata and telemetry that should be accessible in your catalog to make it more useful.
Enrich your service definitions with key metadata
There are a number of key fields you’ll need so that the catalog can be useful as a navigation tool during processes like incident investigations, compliance audits, and security response. These include:
- Team
- On-call engineer
- Contact channel
- Documentation links
- Last deployed version
- Repository links containing the source code
- Runbook links
- Library dependencies and their versions
- Links to relevant dashboards
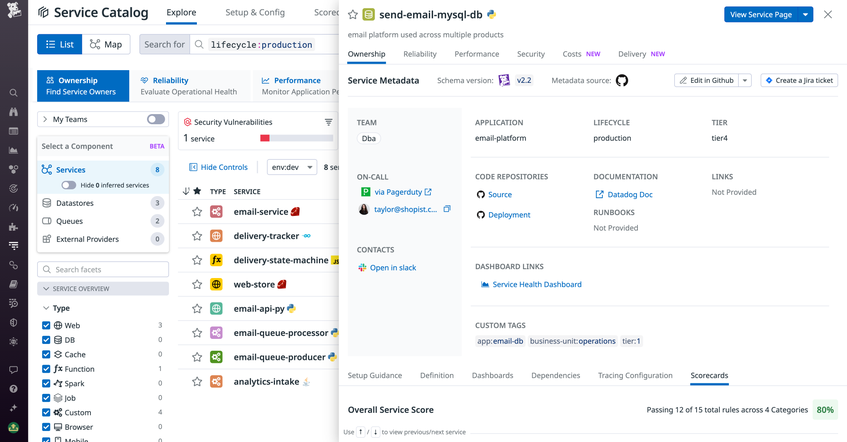
If your teams use spreadsheets to centralize service metadata, you can also write scripts to programmatically map these fields in your service definitions, or, as previously discussed, get them from CMDB tables. Datadog Service Catalog centralizes all this metadata in the service side panel, so your team members can find what they need quickly. The following screenshot shows the send-email-mysql-db service’s side panel, which includes the source code, on-call contact, team Slack channel, documentation, and service health dashboard, among other context.
Connect monitoring data to your catalog
While a static catalog can be a useful knowledge source, you can greatly improve the utility of your catalog by connecting live monitoring data from the rest of your observability platform. This makes the catalog more useful for auditing service health and compliance, characterizing security posture, understanding teams’ observability practices, and more.
To better understand and audit your services’ production readiness, you can connect monitors, deployment tracking, and SLOs to your service definitions. By connecting incident management, error tracking, and key performance metrics such as request volume, errors, and latency to your definitions, the catalog can help you characterize your services’ reliability and performance. And by connecting security telemetry such as detected code vulnerabilities and security violations, as well as security traces and signals, you can use the catalog to understand your services’ security posture. In a static catalog, you can add this telemetry data by including relevant dashboard links in your service definitions.
Datadog Service Catalog lets you access this information more easily by automatically linking your services to this data within corresponding Datadog products via unified service tagging. With unified service tagging, you can persist your service tags across Datadog monitoring tools. These tags can help enrich your service entities with metadata, metrics, and other context sources like Infrastructure Monitoring, RUM, Log Management, Software Delivery, Security, etc. Across all Datadog products, the service tag is used to cross-reference to service entities in the Service Catalog. For example, setting the K8s tags.datadoghq.com/service label will ensure that all pod telemetry (e.g., metrics, logs, resource catalog) carries the service tag and will seamlessly link to the service entities in your catalog.

For monolithic services with numerous endpoints and APIs under the hood, Datadog API Catalog helps you further break down your services into these components. This way, you can also track health and performance signals at the endpoint level for a more granular understanding of service and application health.
Application performance telemetry from Universal Service Monitoring and APM also provides out-of-the-box dependency mapping for your system, so you can easily see how components interact with each other in all your runtime environments. The following screenshot shows that a service called chaos-engineering has an active incident that may be related to errors on its three downstream dependencies.

Use your catalog to streamline monitoring workflows
By centralizing information about services and streamlining their governance, your service catalog helps you collaborate across teams for a number of critical workflows. Users should be able to leverage the service catalog to audit their services for security and reliability requirements, access documentation, tooling, and configuration information, and easily drive downstream actions to help resolve issues faster. Next, we’ll discuss a few monitoring use cases that you can streamline with your service catalog.
Enforce service governance and health standards with scorecards
Scorecards help you codify your organization’s best practices as evaluable rules. By implementing scorecards in your catalog, your teams can measure many dimensions of service quality, including:
- Monitoring coverage
- Production-readiness
- Security posture
- Adoption of the latest internal tooling
- Integration checks
Datadog Service Catalog includes 10 out-of-the-box rules across observability practices, ownership tagging, and production-readiness checkpoints. You can also define your own custom rules. For example, you could create a scorecard that contains a set of rules that map to the steps in your security review process, so that you can quickly audit whether each of your services is compliant. These rules might include checks related to CVE analysis, RBAC configuration, or other security parameters.

Centralize metadata and context for incident response
In the heat of on-call, responders can experience friction when the issue at hand concerns services they don’t own and they can’t find a way to get in touch with those who do. By centralizing documentation, configuration information, contacts, and other useful service metadata, your service catalog can help engineers collaborate more efficiently during incident response.
Datadog Service Catalog lets you configure checks via Scorecards to guarantee that service ownership is correctly tagged, and that key data for each team and service (such as Slack channels, repo URLs, PagerDuty links for the on-call contacts) are valid and up to date. For example, the out-of-the-box “Ownership and Documentation” and “Production Readiness” Scorecards quickly tell you if services include essential documentation and ownership information. The following screenshot shows an “Ownership and Documentation” scorecard evaluation within Service Catalog.

Streamline upgrades and configuration changes
In a distributed architecture, large, multi-service migrations and other configuration changes can be difficult to track. It’s hard to ensure compliance across the board and avoid downtime caused by issues where systems are not upgraded in a synchronized way. Because your service definition file stores all the configuration information needed to populate the catalog, you can use it to establish a single source of truth about other service-level configurations, making it easier to govern the whole process so that teams can work on their upgrades in tandem.
Datadog Service Catalog’s Service Definitions use a JSON schema that includes an extensions field which allows you to add custom metadata to your service definitions. By adding custom fields to tag your services with their dependencies’ currently running versions and their deployment pipelines, you can use Service Catalog to view the upgrade status of your services’ dependencies at a glance. The the code snippet in the following screenshot shows how you can add this metadata to the service_datadog.yaml registry file.

Govern your services from end to end
By building and running a service catalog, you can establish a centralized, encyclopedic knowledge base for telemetry and context for your services across teams and other common organizational silos. Service catalogs streamline governance, helping you audit your teams’ practices as well as their services’ health—and making it easier for team members to conduct complex, multi-service operations like incident response, upgrades, and compliance audits.
Datadog Service Catalog makes it easy to configure and run your catalog, and is flexible enough to adapt to whatever architecture your systems are built on. For more information about Service Catalog, see the documentation. Or, if you’re brand new to Datadog, sign up for a free trial.