
By storing copies of your content in geographically distributed servers, content delivery networks (CDNs) enable you to extend the reach of your app without sacrificing performance. CDNs lessen the demand on individual web hosts by increasing the number and regional spread of servers that are able to respond to incoming requests for cached content. As a result, they can deliver web content faster and provide a better experience for your end users. This model of distributed storage makes CDNs ideal for delivering content that requires transmitting large amounts of data, such as music or video streaming. Additionally, CDNs can help you reduce the impact of network attacks by decentralizing web processing and enabling you to quickly re-route traffic as needed.
Because CDNs play such an important role in managing network traffic, monitoring the logs they produce can give you critical insights into the health of your system. You can use CDN logs to spot issues in resource utilization and network security before they bring your entire app to a halt. But monitoring CDN logs can bring its own set of challenges, particularly given the large volume of logs involved. In this guide, we’ll look at the following aspects of managing and monitoring CDN logs:
- The basic components of CDN logs
- Strategies for analyzing CDN logs to gain insights into network performance and security
- Tools you can use to collect logs from CDN providers
- Features for monitoring CDN logs with Datadog
Understanding CDN logs
CDN logs catalog information about incoming and outgoing web requests, helping you determine who is visiting your app, how often they’re visiting it, and what they access when they’re there. These logs also include information about request performance, including how long it takes to process requests as well as the response size. You can find this information by looking at CDN logs either directly from your app’s web UI or with the help of third-party monitoring tools.
The layout of raw CDN log data can vary based on the specific CDN provider. However, every format includes basic information about the web access request. This can include the IP address, username, timestamp, request action (e.g., GET or POST) and associated resources, HTTP version and status, latency, and response size. You can see an example of a CDN log and its components below:
192.0.2.0 first.last [14/JUN/2023:12:35:45 +0000] “POST /file.pdf HTTP/2.0” 200 110 1500
| CDN Log Component | Example from Sample Log |
|---|---|
| IP address | 192.0.2.0 |
| Username | first.last |
| Timestamp | [14/JUN/2023:12:35:45 +0000] |
| Request line (with HTTP version) | “POST /file.pdf HTTP/2.0” |
| HTTP status | 200 |
| Latency | 110 |
| Response size | 1500 |
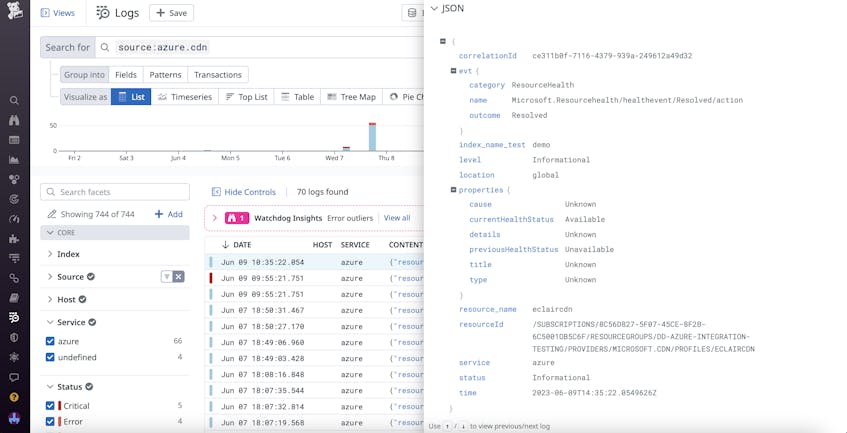
Many CDN providers automatically parse and translate this raw data into a variety of formats for processing, including JSON and W3C. An example of a log with JSON formatting is shown below:
Extracting insights from CDN logs
Each request log provides a wealth of information that can give you insights into the health and performance of your network. However, this abundance of data can be a double-edged sword: on the one hand, it makes it easy to leverage your CDN logs for a variety of purposes and use cases. On the other hand, the high volume of logs being ingested from across your CDN can make it difficult to identify the information most relevant to your troubleshooting activity.
One way to address this challenge is to use both CDN log file names as well as data from the CDN logs themselves to group your logs, which can make it easier to dig into details during troubleshooting. For example, let’s say you’re working with an entertainment platform that expects an influx of users during a worldwide movie release and wants to analyze their network performance during the premiere. You can filter and group your CDN logs based on their timestamps to monitor the increase in traffic to your CDN servers, helping you quickly spot resources that might be overloaded. Then, to organize logs relating to this event for further analysis, you can name the relevant log files with the date and short description of the event.
Next, we’ll look at some different types of information that you can extract from CDN logs.
Using CDN logs to monitor performance
You can use CDN performance data, such as latency and HTTP status, to monitor the health of your network and evaluate whether user requests are being processed efficiently. This is especially useful when ensuring smooth network performance during events that generate high amounts of secondary traffic, such as customer queries related to seasonal sales or the introduction of new features. Monitoring your CDN logs in these instances enables you to spot issues such as uneven load distribution in your network, enabling you to quickly reallocate resources as needed.
Using CDN logs to monitor security
Because CDN logs contain information about network access, they can be invaluable for monitoring security. CDN logs can help you detect not just that an attack is happening, but also what strategy is being used and how you can stop it. For example, a sudden spike in requests from one IP address may indicate a denial of service (DoS) attack. If this occurs, you can use the IP address and username information from the logs to quickly block the attack. At the same time, a sudden flood of suspicious requests from a wide range of IP addresses may indicate a DDoS attack instead. DDoS attacks can require different tactics to manage, such as rate limiting, so this distinction is crucial.
Collecting logs from CDN providers
To help facilitate log analysis, CDN providers offer a number of tools that enable you to collect and categorize your logs. For example:
- Akamai gives you a number of features that you can use to stream and monitor your CDN logs. These include Datastream 2, which provides low-latency log delivery, and mPulse for analyzing real-user data.
- Amazon CloudFront enables you to collect logs via Amazon Kinesis, a serverless data streaming service. Kinesis Data Streams ingests logs directly from your CloudFront distributions, then forwards them to Kinesis Data Firehose for transformation.
- Fastly has native real-time log streaming features that you can use to export logs, via either the syslog protocol or by pushing log files to S3-compatible providers. Additionally, you can send these logs to a variety of endpoints via Fastly’s third-party integrations.
- Cloudflare comes with Cloudflare Logpush, which enables you to stream logs from your CDN devices in batches. In addition to analyzing your logs via the native Cloudflare dashboard, you can also export logs to third-party tools by using Cloudflare’s API.
These features can help you collect and transform CDN logs from devices across your network’s edge. Additionally, many providers include native troubleshooting tools that enable you to spot ongoing issues in your logs and perform simple debugging. To perform more in-depth investigations, though, you often need to correlate your CDN logs with other logs, traces, and metrics from your stack—for this, you may need to send your logs to external monitoring platforms.
Monitoring your CDN logs with Datadog
CDN logs contain critical information that can inform your efforts to monitor network performance and conduct time-sensitive security investigations. However, even after organizing your CDN logs, it can be challenging to effectively utilize this information in your troubleshooting activity. For example, pinpointing the root cause of an issue may require cross-referencing your CDN logs with other indicators of network health, such SNMP metrics, in order to figure out what has gone wrong. Monitoring platforms such as Datadog can help you aggregate, visualize, and correlate CDN logs alongside metrics and traces from your entire system, enabling you to see all your data in one view.
To ingest CDN logs into Datadog from a host, application, or container, you can use the Datadog Agent or one of our turn-key integrations. Datadog provides a number of integrations with CDN network providers to help you seamlessly collect and monitor logs. We connect directly with providers—including Akamai, Amazon Cloudfront, Fastly, and Cloudflare—to gather all your logs from the edge of your network.
Searching and filtering your logs with Datadog Log Management
Once you’ve ingested your CDN logs, you can leverage Datadog Log Management to analyze them. Log Management’s processing pipelines enable you to enrich and categorize your incoming logs, making it easier to manage data from your CDN. Additionally, you can also quickly find crucial information within your CDN logs by using features such as reference table filtering and CIDR search.
Reference tables provide valuable context by enabling you to query your logs based on collections of relevant information. For example, many security teams keep continuously updated tables of known malicious IP addresses to help them spot attacks to their networks. To identify attacks directed at your CDN servers, you can easily filter your logs (both old and new) based on the addresses in these tables. You can also perform a similar function using CIDR search. By using the CIDR() operator, you can filter your searches for blocks of known malicious IP addresses, making it easier to spot suspicious activity.
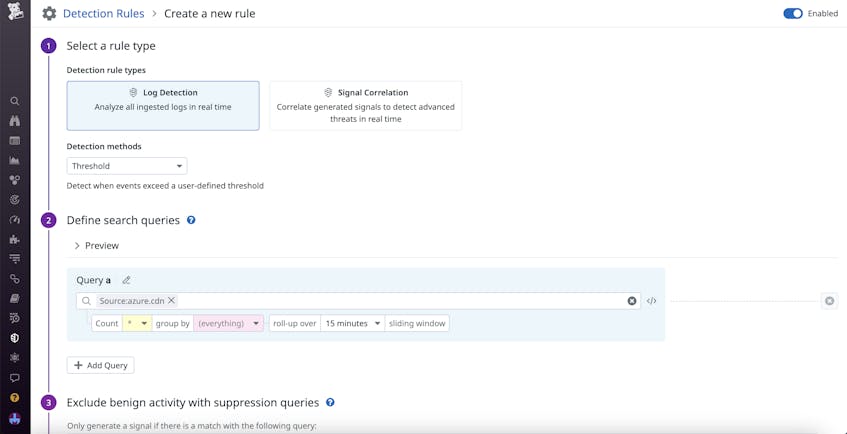
Creating detection rules with Datadog Cloud SIEM
If you do notice requests coming from malicious IP addresses, you can leverage detection rules in Datadog Cloud SIEM to quickly ban them. Cloud SIEM automatically analyzes your incoming log data for anomalous activity—by using detection rules, you can define what CDN activity you’d like to receive alerts for. Depending on the kind of traffic you expect your servers to normally receive, you can configure different detection rules to identify events such as DoS or DDoS attacks. For CDNs that deliver content to a large number of external users, anomaly and threshold rules can help you detect suspicious influxes of traffic, such as a flood of requests from a small set of IP addresses. You can also configure these alerts to automatically send IP information to your cloud’s identity and access management (IAM) tools to streamline incident management.
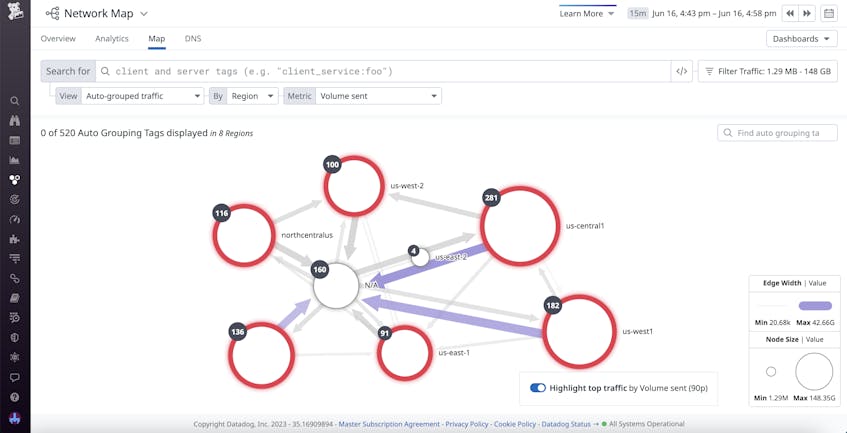
Correlating log data within Datadog NPM
Datadog Network Performance Monitoring (NPM) provides features that can help you troubleshoot network performance issues present in your CDN logs. You can add CDN logs to your network overview dashboards, enabling you to quickly spot issues and troubleshoot using other network metrics, such as throughput and utilization. Once you notice an issue, such as a sharp increase in latency, you can pivot to NPM to analyze relevant data in order to determine the source of the issue. You’re able to easily filter your client and server tags to follow the flow of requests throughout your servers, as well as visualize bottlenecks with the network map.
Start analyzing your CDN logs with Datadog
In this post, we explored how CDN logs give you visibility into your network security and performance. CDN logs provide essential information on who’s accessing your network and why, but the sheer volume of data that these logs produce can make them difficult to analyze. With Log Management, Datadog helps you extract only the details most relevant to your investigations and enrich them with important context. Then, you can use Cloud SIEM to quickly take action on suspicious activity, or pivot to NPM to find the root cause of performance issues.
To begin ingesting your CDN logs into Datadog, you can view our documentation. Or, if you’re not yet a Datadog user, you can sign up for a 14-day free trial today.
