---
title: "Monitoring Amazon Aurora performance metrics"
description: "Learn how monitoring Amazon Aurora can help your infrastructure performance. Track key metrics on query throughput, latency, resource utilization, and more."
author: "John Matson"
date: 2015-11-19
tags: ["infrastructure monitoring", "database monitoring", "aws", "amazon aurora", "mysql", "aws rds aurora"]
blog_type_id: the-monitor
locale: en
---
*Editor’s note: Amazon Aurora and MySQL use the terms “master” and “slave” to describe their architectures. Datadog does not use these terms. Within this blog post, we will refer to these terms as "source" and “replica."*
*This post is part 1 of a 3-part series about monitoring the MySQL-compatible edition of Amazon Aurora on Amazon RDS. *[*Part 2*](https://www.datadoghq.com/blog/how-to-collect-aurora-metrics.md)* is about collecting metrics from Aurora, and *[*Part 3*](https://www.datadoghq.com/blog/monitor-aurora-using-datadog.md)* details how to monitor Aurora with Datadog.*
## What is Aurora?
[Amazon Aurora](https://aws.amazon.com/rds/aurora/) is a MySQL-compatible database offered on RDS (Relational Database Service), a hosted database service in the AWS cloud. RDS users can choose from several well-known database engines that are also available as standalone products, including MySQL, Oracle, SQL Server, Postgres, and MariaDB, but Aurora is only available on RDS.
Aurora offers unique features such as auto-scaling storage, extremely low-latency replication, and rapid automated failover to a standby instance. Amazon advertises throughput enhancements of up to 5x as compared to MySQL running on similar hardware. Aurora users also have access to an expanded suite of [monitoring metrics](http://docs.aws.amazon.com/AmazonRDS/latest/UserGuide/Aurora.Monitoring.html) as compared to other RDS users. Aurora exposes not just system- and disk-level metrics but also crucial metrics on query throughput and latency, as detailed below. Note that Aurora also offers a PostgreSQL-compatible engine, but this series focuses specifically on monitoring the MySQL-compatible engine.
## Key metrics for monitoring Amazon Aurora
To keep your applications running smoothly, it is important to understand and track performance metrics in the following areas:
- [Query throughput](#query-throughput)
- [Query performance](#query-performance)
- [Resource utilization](#resource-utilization)
- [Connections](#connection-metrics)
- [Read replica metrics](#read-replica-metrics)
RDS exposes dozens of high-level metrics, and Aurora users can access literally hundreds more from the MySQL-compatible database engine. With so many metrics available, it's not always easy to tell what you should focus on. In this article we'll highlight key metrics in each of the above areas that together give you a detailed view of your database's performance.
RDS metrics (as opposed to storage engine metrics) are available through Amazon CloudWatch, and many are available regardless of which database engine you use. Engine metrics, on the other hand, can be accessed from the database instance itself. [Part 2 of this series](https://www.datadoghq.com/blog/how-to-collect-aurora-metrics.md) explains how to collect both types of metrics. Standard CloudWatch Aurora metrics are available at one-minute intervals; database engine metrics can be collected at even higher resolution.
This article references metric terminology introduced in [our Monitoring 101 series](https://www.datadoghq.com/blog/monitoring-101-collecting-data.md), which provides a framework for metric collection and alerting.
### Compatibility with MySQL and MariaDB
Because Aurora is compatible with MySQL 5.6, standard MySQL administration and monitoring tools, such as the `mysql` command line interface, will generally work with Aurora without modification. And most of the strategies outlined here also apply to MySQL and MariaDB on RDS. But there are some key differences between the database engines. For instance, Aurora has auto-scaling storage, so it does not expose a metric tracking free storage space. And the version of MariaDB (10.0.17) available on RDS at the time of this writing is not fully compatible with some of the metric collection tools detailed in [Part 2](https://www.datadoghq.com/blog/how-to-collect-aurora-metrics.md) of this series. MySQL users should check out our three-part series on [monitoring MySQL on RDS](https://www.datadoghq.com/blog/monitoring-rds-mysql-performance-metrics.md).
### Query throughput
| Metric description | CloudWatch name | MySQL name | Metric type |
| --- | --- | --- | --- |
| Queries | Queries (per second) | Queries (count) | Work: Throughput |
| Reads | SelectThroughput (per second) | Comselect + Qcachehits (count) | Work: Throughput |
| Writes | DMLThroughput (per second) | Cominsert + Comupdate + Com_delete (count) | Work: Throughput |
Your primary concern in monitoring any system is making sure that its [work is being done](https://www.datadoghq.com/blog/monitoring-101-collecting-data.md#work-metrics) effectively. A database's work is running queries, so the first priority in any monitoring strategy should be making sure that queries are being executed.
You can also monitor the breakdown of read and write commands to better understand your database's read/write balance and identify potential bottlenecks. Those metrics can be collected directly from Amazon CloudWatch or computed by summing native MySQL metrics from the database engine. In MySQL metrics, reads increment one of two status variables, depending on whether or not the read is served from the query cache:
Reads = `Com_select` + `Qcache_hits`
Writes increment one of three status variables, depending on the command:
Writes = `Com_insert` + `Com_update` + `Com_delete`
In CloudWatch metrics, all DML requests (inserts, updates, and deletes) are rolled into the `DMLThroughput` metric, and all `SELECT` statements are incorporated in the `SelectThroughput` metric, whether or not the query is served from the query cache.
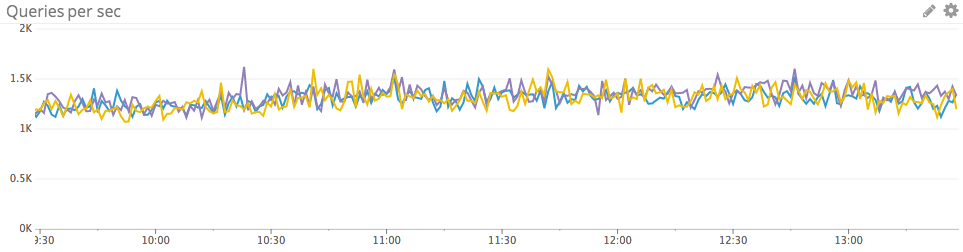
#### Metric to alert on: Queries per second
The current rate of queries will naturally rise and fall, and as such is not always an actionable metric based on fixed thresholds alone. But it is worthwhile to alert on sudden changes in query volume—drastic drops in throughput, especially, can indicate a serious problem.
### Query performance
| Metric description | CloudWatch name | MySQL name | Metric type |
| --- | --- | --- | --- |
| Read query latency, in milliseconds | SelectLatency | - | Work: Performance |
| Write query latency, in milliseconds | DMLLatency | - | Work: Performance |
| Queries exceeding long_query_time limit | - | Slow_queries | Work: Performance |
| Query errors | - | (Only available via database query) | Work: Error |
The Aurora-only metrics for `SELECT` latency and DML (insert, update, or delete) latency capture a critical measure of query performance. Along with query volume, latency should be among the top metrics monitored for almost any use case.
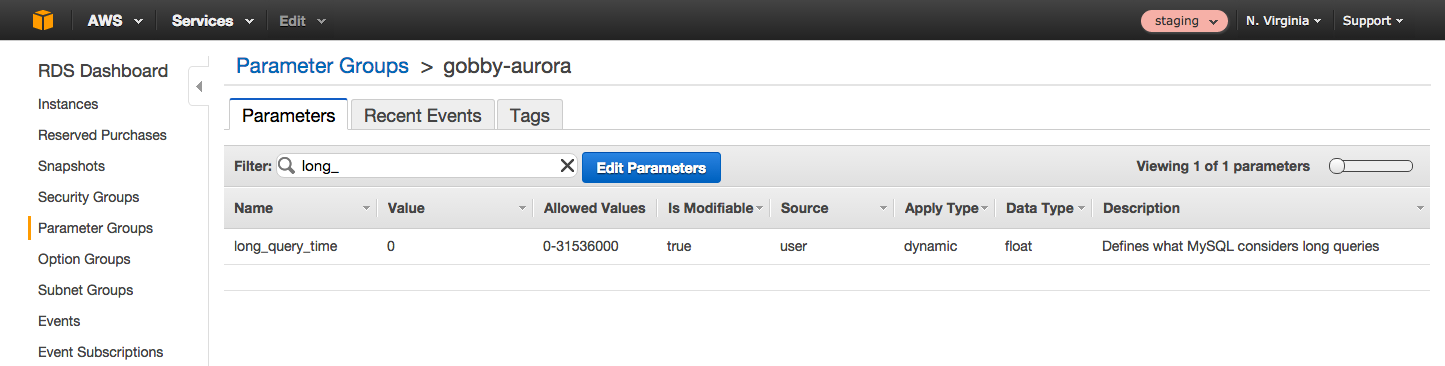
MySQL (and therefore Aurora) also features a `Slow_queries` metric, which increments every time a query's execution time exceeds the number of seconds specified by the `long_query_time` parameter. To modify `long_query_time` (or any other database parameter), simply log in to the AWS Console, navigate to the RDS Dashboard, and select the parameter group that your RDS instance belongs to. You can then filter to find the parameter you want to edit.
For a deeper look into query performance, the MySQL [performance schema](https://dev.mysql.com/doc/refman/5.6/en/performance-schema.html) (which is compatible with Aurora but is disabled by default) also stores valuable statistics, including query latency, from the database server. Though you can query the performance schema directly, it is easier to use Mark Leith’s [sys schema](https://github.com/mysql/mysql-sys), which provides convenient views, functions, and procedures to gather metrics from MySQL or Aurora. For instance, to find the execution time of all the different statement types executed by each user:
```text
mysql> select * from sys.user_summary_by_statement_type;
```
Or, to find the slowest statements (those in the 95th percentile by runtime):
```text
mysql> select * from sys.statements_with_runtimes_in_95th_percentile\G
```
Many useful usage examples are detailed in the sys schema [documentation](https://github.com/mysql/mysql-sys).
To enable the performance schema, you must set the `performance_schema` parameter to 1 in the database instance's parameter group using the AWS console. If not enabled, this change requires an instance reboot. More about enabling the performance schema and installing the sys schema in [Part 2](https://www.datadoghq.com/blog/how-to-collect-aurora-metrics.md) of this series.
The performance schema and sys schema also allow you to quickly assess how many queries generated errors or warnings:
```text
mysql> SELECT SUM(errors) FROM sys.statements_with_errors_or_warnings;
```
#### Metrics to alert on
- Latency: Slow reads or writes will necessarily add latency to any application that relies on Aurora. If your queries are executing more slowly than expected, evaluate your RDS [resource metrics](#resource-utilization). Aurora users also have a number of caching options to expedite transactions, from making more RAM available for the [buffer pool](https://dev.mysql.com/doc/refman/5.6/en/innodb-buffer-pool.html) used by InnoDB (usually by upgrading to a larger instance), to enabling or expanding the [query cache](https://dev.mysql.com/doc/refman/5.6/en/query-cache.html) that serves identical queries from memory, to using an application-level cache such as Memcached or [Redis](https://www.datadoghq.com/blog/how-to-monitor-redis-performance-metrics.md).
- `Slow_queries`: How you define a slow query (and therefore how you configure the `long_query_time` parameter) will depend heavily on your use case and performance requirements. If the number of slow queries reaches worrisome levels, you will likely want to identify the actual queries that are executing slowly so you can optimize them. You can do this by querying the sys schema or by configuring Aurora to log all slow queries. More information on enabling and accessing the slow query log is available [in the RDS documentation](http://docs.aws.amazon.com/AmazonRDS/latest/UserGuide/USER_LogAccess.Concepts.MySQL.html#USER_LogAccess.MySQL.Generallog).
```text
mysql> SELECT * FROM mysql.slow_log LIMIT 10\G
*************************** 1. row ***************************
start_time: 2015-11-13 11:09:14
user_host: gob[gob] @ [x.x.x.x]
query_time: 00:00:03
lock_time: 00:00:00
rows_sent: 2844047
rows_examined: 3144071
db: employees
last_insert_id: 0
insert_id: 0
server_id: 1656409327
sql_text: select * from employees left join salaries using (emp_no)
thread_id: 21260
```
- Query errors: A sudden increase in query errors can indicate a problem with your client application or your database. You can use the sys schema to quickly explore which queries may be causing problems. For instance, to list the 10 normalized statements that have returned the most errors:
```text
mysql> SELECT * FROM sys.statements_with_errors_or_warnings ORDER BY errors DESC LIMIT 10\G
```
### Resource utilization
#### Disk I/O metrics
| Description | CloudWatch name | Enhanced monitoring name | Metric type |
| --- | --- | --- | --- |
| Read I/O operations per second | ReadIOPS | diskIO.readIOsPS | Resource: Utilization |
| Write I/O operations per second | WriteIOPS | diskIO.writeIOsPS | Resource: Utilization |
| I/O operations waiting for disk access | DiskQueueDepth | diskIO.diskQueueDepth | Resource: Saturation |
| Milliseconds per read I/O operation | ReadLatency | diskIO.readLatency | Resource: Other |
| Milliseconds per write I/O operation | WriteLatency | diskIO.writeLatency | Resource: Other |
#### CPU, memory, and network metrics
| Description | CloudWatch name | Enhanced monitoring name | Metric type |
| --- | --- | --- | --- |
| Percent CPU utilized | CPUUtilization | cpuUtilization.total | Resource: Utilization |
| Available RAM in gigabytes | FreeableMemory | memory.free | Resource: Utilization |
| Network traffic to the Aurora instance | NetworkReceive Throughput (MB/s) | network.rx (packets) | Resource: Utilization |
| Network traffic from the Aurora instance | NetworkTransmit Throughput (MB/s) | network.tx (packets) | Resource: Utilization |
As Baron Schwartz, co-author of [*High Performance MySQL*](http://shop.oreilly.com/product/0636920022343.do)*,* often notes, a database needs four fundamental resources: CPU, memory, disk, and network. Any of these can become a performance bottleneck—for a look at how difference RDS instance types can be constrained by their available resources, check out [this 2013 talk](https://www.youtube.com/watch?v=t6Os_bBNJE0&t=16m12s) by Amazon's Grant McAlister.
Whenever your database instance experiences performance problems, you should check metrics pertaining to the four fundamental resources to look for bottlenecks. As of December 2015, RDS users have access to [enhanced monitoring](https://aws.amazon.com/blogs/aws/new-enhanced-monitoring-for-amazon-rds-mysql-5-6-mariadb-and-aurora/) functionality that exposes detailed system-level metrics for RDS instances. Even out of the box, however, CloudWatch does make available basic metrics, detailed below, on all four fundamental resources. For the most part, these metrics are most useful for [investigating (rather than detecting)](https://www.datadoghq.com/blog/monitoring-101-investigation.md) performance issues.
#### Disk I/O metrics
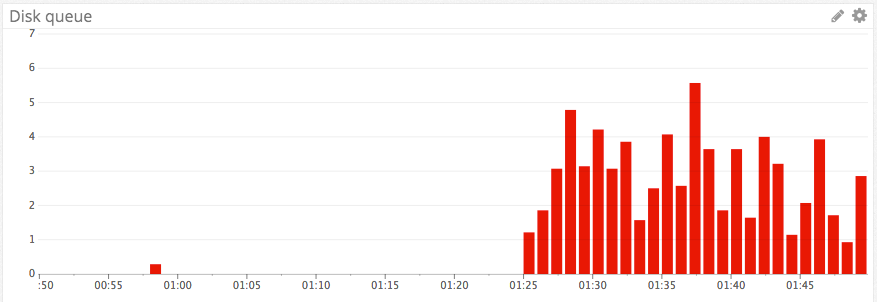
CloudWatch makes available RDS metrics on read and write IOPS, which indicate how much your database is interacting with backing storage. If your storage volumes cannot keep pace with the volume of read and write requests, you will start to see I/O operations queuing up. The `DiskQueueDepth` metric measures the length of this queue at any given moment.
Note that there will not be a one-to-one correspondence between queries and disk operations—queries that can be served from memory will bypass disk, for instance, and queries that return a large amount of data can involve more than one I/O operation.
In addition to I/O throughput metrics, RDS offers `ReadLatency` and `WriteLatency` metrics. These metrics do not capture full query latency—they only measure how long your I/O operations are taking at the disk level.
For read-heavy applications, one way to overcome I/O limitations is to [create a read replica](http://docs.aws.amazon.com/AmazonRDS/latest/UserGuide/Aurora.Replication.html) of the database to serve some of the client read requests. Aurora allows you to create up to 15 replicas for every source instance. For more, see the [section below](#read-replica-metrics) on metrics for read replicas.
#### CPU metrics
High CPU utilization is not necessarily a bad sign. But if your database is performing poorly while metrics for IOPS and network are in normal ranges, and while the instance appears to have sufficient memory, the CPUs of your chosen instance type may be the bottleneck.
#### Memory metrics
Databases perform best when most of the working set of data can be held in memory. For this reason, you should monitor `FreeableMemory` to ensure that your database instance is not memory-constrained. AWS advises that you use the ReadIOPS metric to determine whether the working set is largely in memory:
> To tell if your working set is almost all in memory, check the ReadIOPS metric (using AWS CloudWatch) while the DB instance is under load. The value of ReadIOPS should be small and stable.
>
>
#### Network metrics
Unlike other RDS database engines, Aurora's network throughput metrics do not include network traffic from the database instances to the storage volumes. The `NetworkReceiveThroughput` and `NetworkTransmitThroughput` metrics therefore track only network traffic to and from clients.
#### Metrics to alert on
- `DiskQueueDepth`: It is not unusual to have some requests in the disk queue, but investigation may be in order if this metric starts to climb, especially if latency increases as a result. (Time spent in the disk queue adds to read and write latency.)
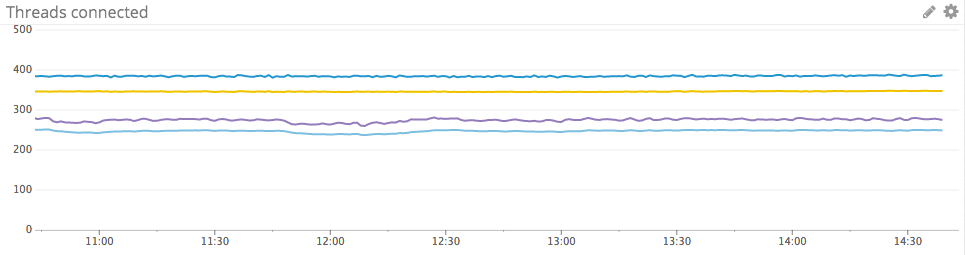
### Connection metrics
| Metric description | CloudWatch name | MySQL name | Metric type |
| --- | --- | --- | --- |
| Open database connections | DatabaseConnections | Threads_connected | Resource: Utilization |
| Currently running connections | - | Threads_running | Resource: Utilization |
| Failed connection attempts | LoginFailures (per second) | Aborted_connects (count) | Resource: Error |
| Count of connections refused due to server error | - | Connectionerrors internal | Resource: Error |
| Count of connections refused due to max_connections limit | - | Connectionerrors max_connections | Resource: Error |
Monitoring how many client connections are in use is critical to understanding your database's activity and capacity. Aurora has a configurable connection limit; the default value depends on the memory of the database's instance class in bytes, according to the formula:
`log(DBInstanceClassMemory/8187281408)*1000`
The `max_connections` parameter can be checked or modified via the database instance's parameter group using the RDS dashboard in the AWS console. You can also check the current value of `max_connections` by querying the Aurora instance itself (see [part 2](https://www.datadoghq.com/blog/how-to-collect-aurora-metrics.md) of this series for more on connecting to RDS instances directly):
```text
mysql> SELECT @@max_connections;
+-------------------+
| @@max_connections |
+-------------------+
| 1000 |
+-------------------+
1 row in set (0.00 sec)
```
To monitor how many connections are in use, CloudWatch exposes a `DatabaseConnections` metric tracking open connections, and the database engine exposes a similar `Threads_connected` metric. The `Threads_running` metric provides additional visibility by isolating the threads that are actively processing queries.
If your server reaches the `max_connections` limit and starts to refuse connections, `Connection_errors_max_connections` will be incremented, as will the `Aborted_connects` metric tracking all failed connection attempts. CloudWatch also tracks failed connections via the `LoginFailures` metric.
Aurora's database engine exposes a variety of other metrics on connection errors, which can help you identify client issues as well as serious issues with the database instance itself. The metric `Connection_errors_internal` is a good one to watch, because it is incremented when the error comes from the server itself. Internal errors can reflect an out-of-memory condition or the server's inability to start a new thread.
#### Metrics to alert on
- Open database connections: If a client attempts to connect to Aurora when all available connections are in use, Aurora will return a "Too many connections" error and increment `Connection_errors_max_connections`. To prevent this scenario, you should monitor the number of open connections and make sure that it remains safely below the configured limit.
- Failed connection attempts: If this metric is increasing, your clients are probably trying and failing to connect to the database. Dig deeper with metrics such as `Connection_errors_max_connections` and `Connection_errors_internal` to diagnose the problem.
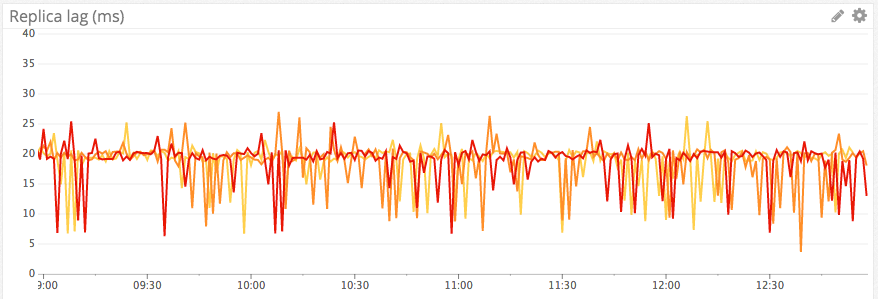
### Read replica metrics
| Name | Description | Metric type | Availability |
| --- | --- | --- | --- |
| AuroraReplicaLag | Number of milliseconds by which replica trails source instance | Other | CloudWatch |
Aurora supports the creation of up to 15 read replicas from the source instance. These replicas are assigned a separate endpoint, so you can point client applications to read from a replica rather than from the source instance. You can also monitor the replica's connections, throughput, and query performance, just as you would for an ordinary RDS instance.
The lag time for any read replica is captured by the CloudWatch metric `AuroraReplicaLag`. This metric is usually not actionable, although if the lag is consistently very long, you should investigate your settings and resource usage.
Note that this is a significantly different metric than the generic RDS metric `ReplicaLag`, which applies to other database engines. Because Aurora instances all read from the same virtual storage volume, the `AuroraReplicaLag` tracks the lag in page cache updates from source to replica rather than the lag in applying all write operations from the source instance to the replica.
## Conclusion
In this post we have explored the most important metrics you should monitor to keep tabs on performance for Amazon Aurora. If you are just getting started with Aurora, monitoring the metrics listed below will give you great insight into your database’s activity and performance. They will also help you to identify when it is necessary to upgrade your instance type or add read replicas to maintain good application performance.
- [Query throughput](#query-throughput)
- [Query latency and errors](#query-performance)
- [Disk queue depth](#disk-io-metrics)
- [Client connections and errors](#connection-metrics)
[Part 2](https://www.datadoghq.com/blog/how-to-collect-aurora-metrics.md) of this series provides instructions for collecting all the metrics you need from CloudWatch and from the Aurora instance itself.