Bowen Chen

Anjali Thatte
Ray is an open source compute framework that simplifies the scaling of AI and Python workloads for on-premise and cloud clusters. Ray integrates with popular libraries, data stores, and tools within the machine learning (ML) ecosystem, including Scikit-learn, PyTorch, and TensorFlow. This gives developers the flexibility to scale complex AI applications without making changes to their existing workflows or AI stack.
Datadog now integrates with Ray, enabling you to collect key metrics and logs that help you monitor the health of your Ray nodes as your AI applications scale. In this post, we’ll cover visualizing telemetry from your Ray environment and alerting on Ray issues with Datadog’s out-of-the-box (OOTB) monitors.
Visualize telemetry from your Ray environment
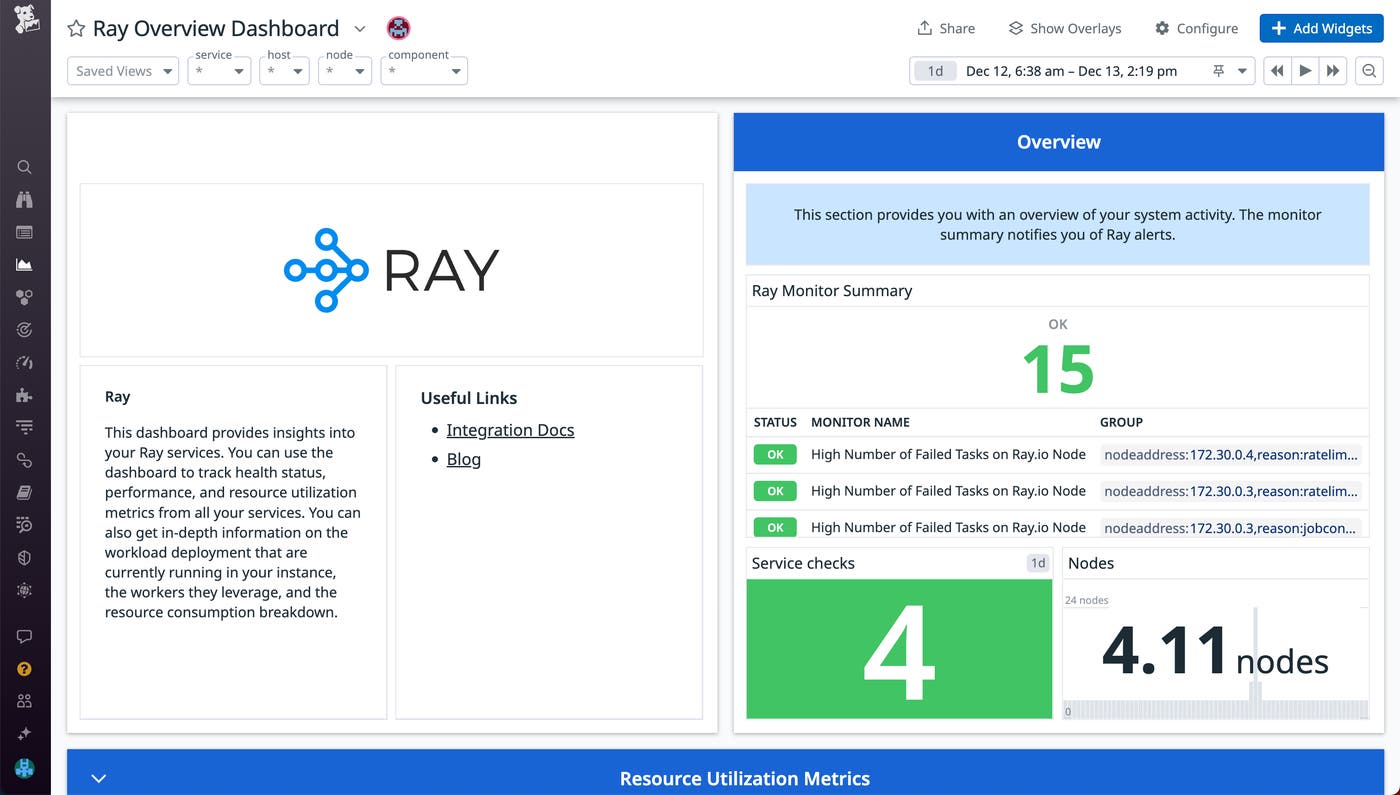
After you install our Ray integration, you’ll gain immediate access to an OOTB dashboard that helps you visualize telemetry from your Ray nodes. Ray is typically deployed as a cluster of worker nodes. Each worker node is equipped with Ray’s AI libraries and can execute functions as remote Ray tasks or instantiate classes as Ray actors that can be used to run compute workloads in parallel.
Using Datadog’s dashboard, you can visualize the real-time status of any monitors you’ve configured on Ray metrics or logs. You can also monitor the health of Ray nodes within your cluster or dive deeper into the status of individual tasks. Next, we’ll explore how you can use the dashboard to:
Identify bottlenecks and failing tasks
Datadog’s Ray dashboard can help you investigate tasks that are stalled or failing. The “Pending Tasks with Reason for Blocker” chart enables you to visualize tasks that were unable to be scheduled on each Ray node and also provides the reason for the corresponding bottleneck (waiting on resources, workers, etc). Similarly, you can view tasks that failed because Ray was unable to assign them to a worker. The chart includes the reason for each failure, such as missing job configurations, rate limiting, or registration timeouts. By helping you pinpoint blocked or fail tasks on your nodes, the dashboard provides the perfect launching point to begin troubleshooting performance issues in Ray.
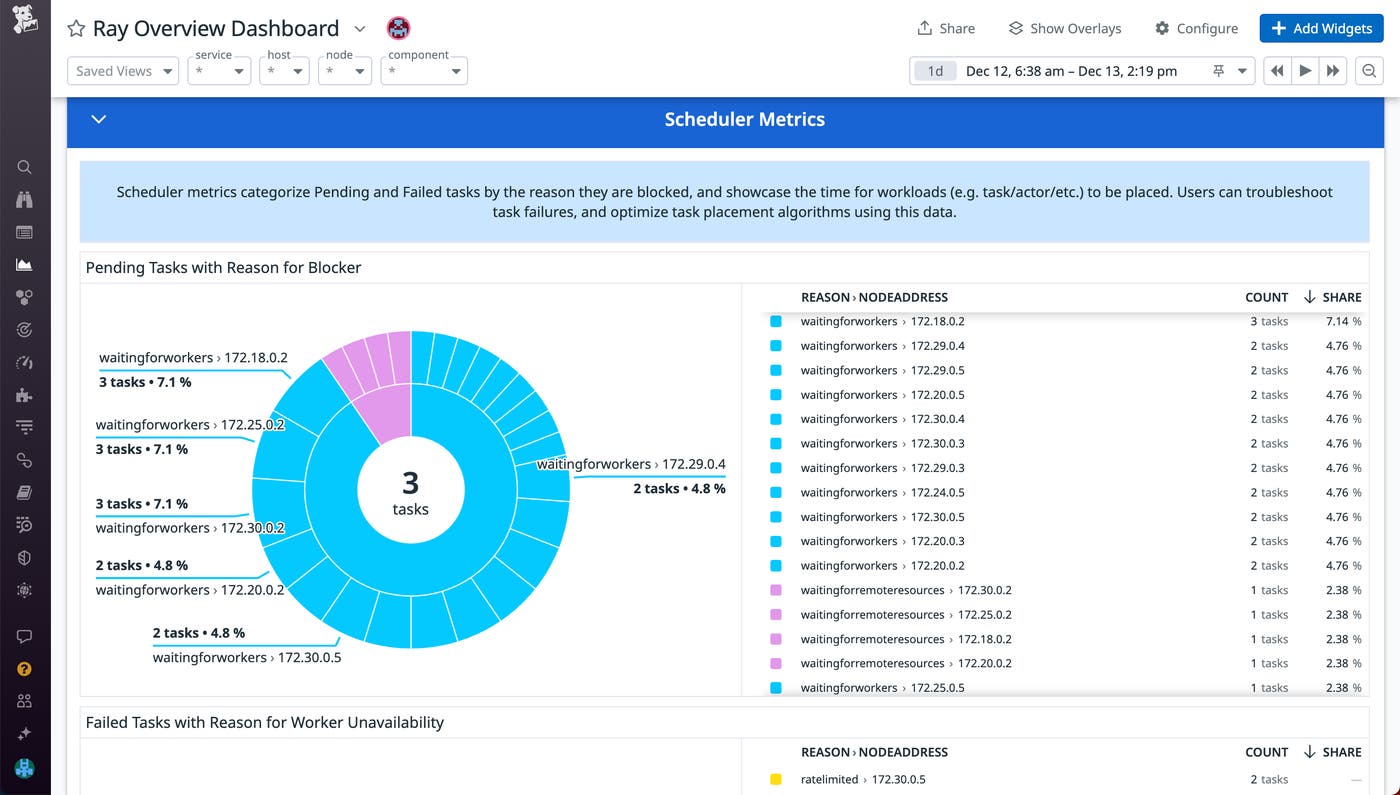
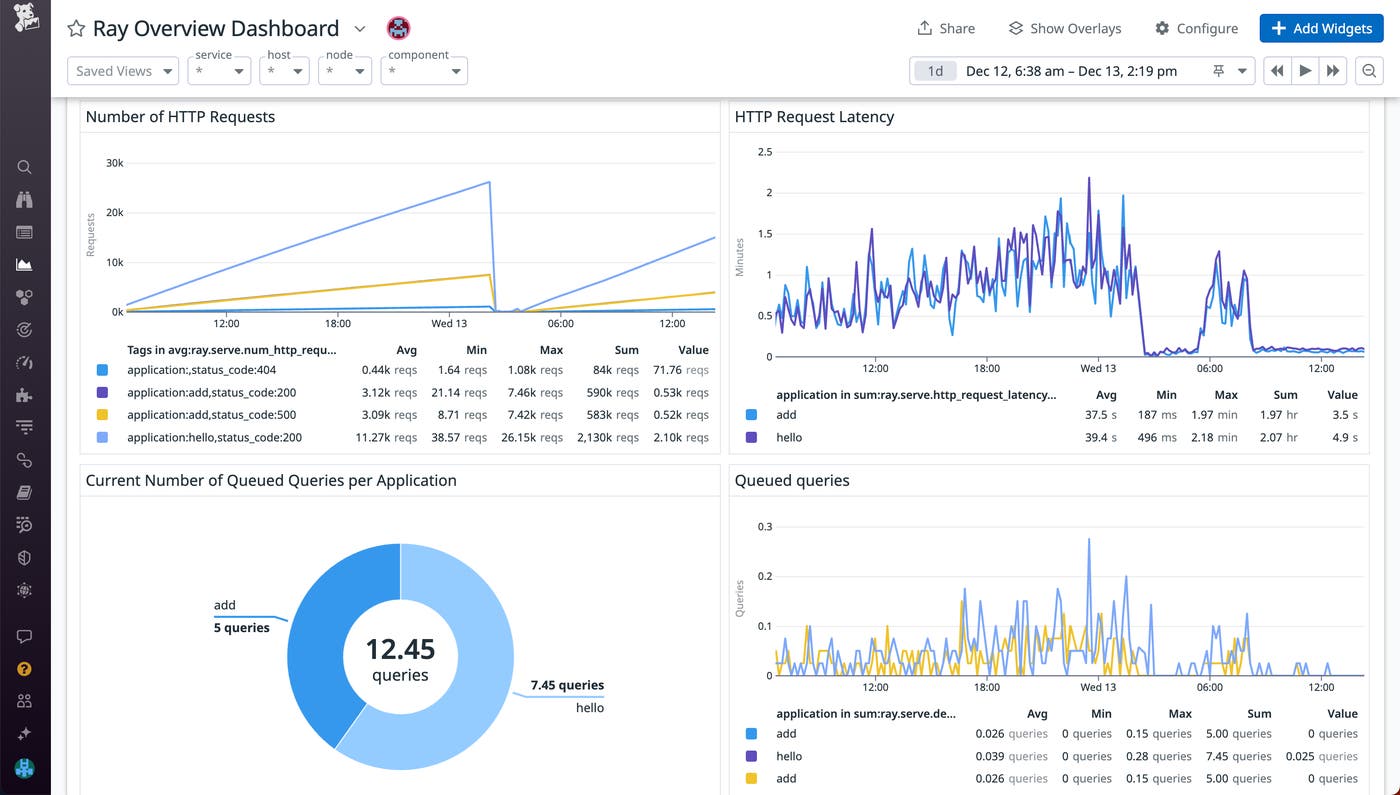
To debug a large number of pending or failed tasks, check for common oversights. Verify that your Ray nodes are all part of your cluster (using the ray.nodes() terminal command), that the logical number of GPUs you’ve assigned to each task doesn’t exceed the capacity for the physical machine, and that all workers are active when they should be. Tracking these metrics—alongside other data, such as HTTP request latency, error logs, and the number of queued queries per application—can quickly highlight potential issues as you use Ray to scale your applications.
Improve the resource efficiency of your Ray cluster
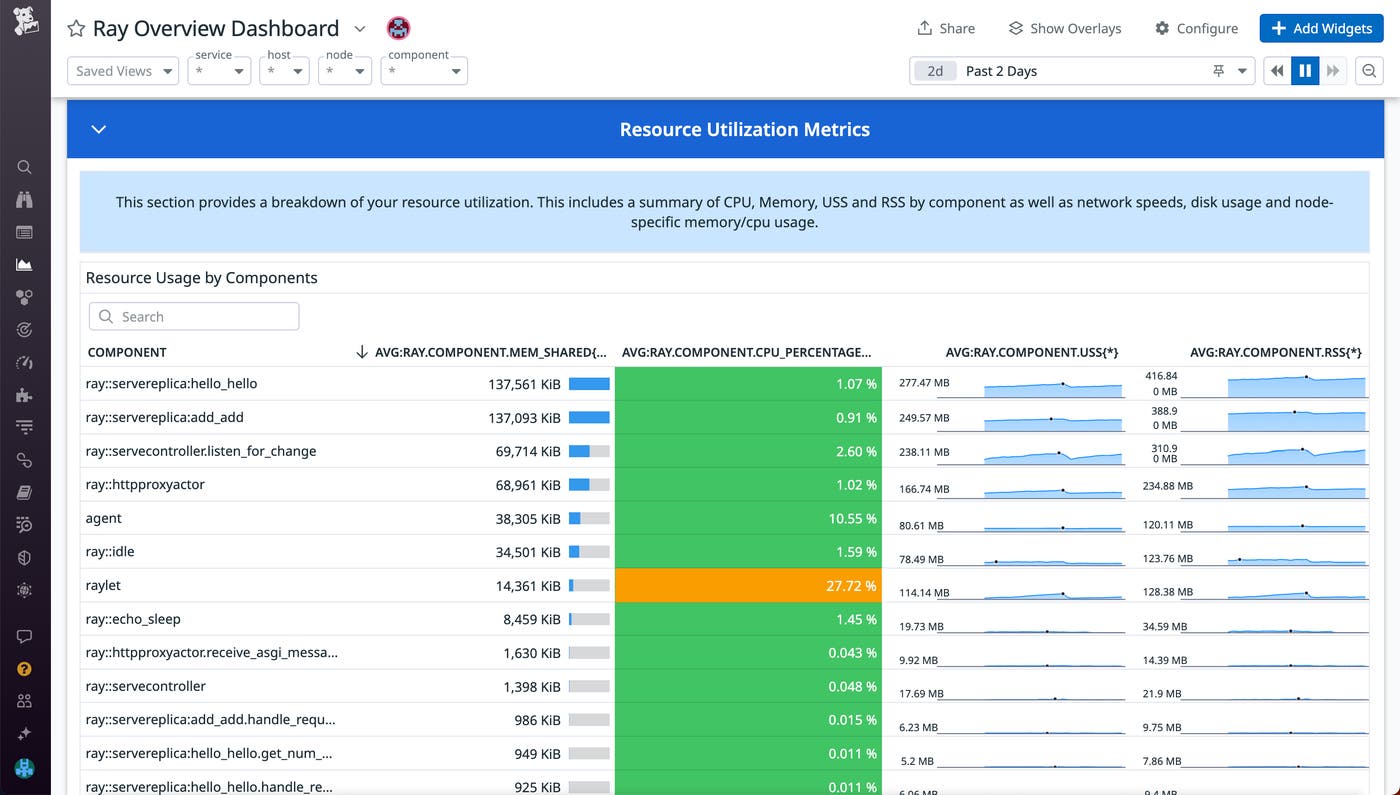
Datadog’s dashboard also enables you to easily track and manage the resource consumption of different Ray components. Using the table shown below, you can sort and break down the memory and CPU usage of each component (e.g., task or actor) running on your nodes, enabling you to quickly identify and address resource constraints and inefficiencies.
For example, high memory or CPU usage for a specific component may indicate that you need to turn off multithreading (if it’s enabled) and reduce the number of tasks running at the same time. Concurrently loading training data on too many workers at a time risks exceeding each node’s memory capacity.
When scaling your AI and high-compute workloads, maximizing the efficiency of your compute resources can reduce operating costs or speed up training times. The dashboard displays metrics such as disk usage (ray.node.disk.usage) and node GPU utilization (ray.node.gpus_utilization) that can help you quickly identify Ray nodes that are utilizing excessive disk I/O or underutilizing their GPU resources. If you notice that GPUs are being underutilized on nodes that have multiple GPU cores available, verify that those nodes’ running tasks’ or actors’ resource requirements are correctly specified.
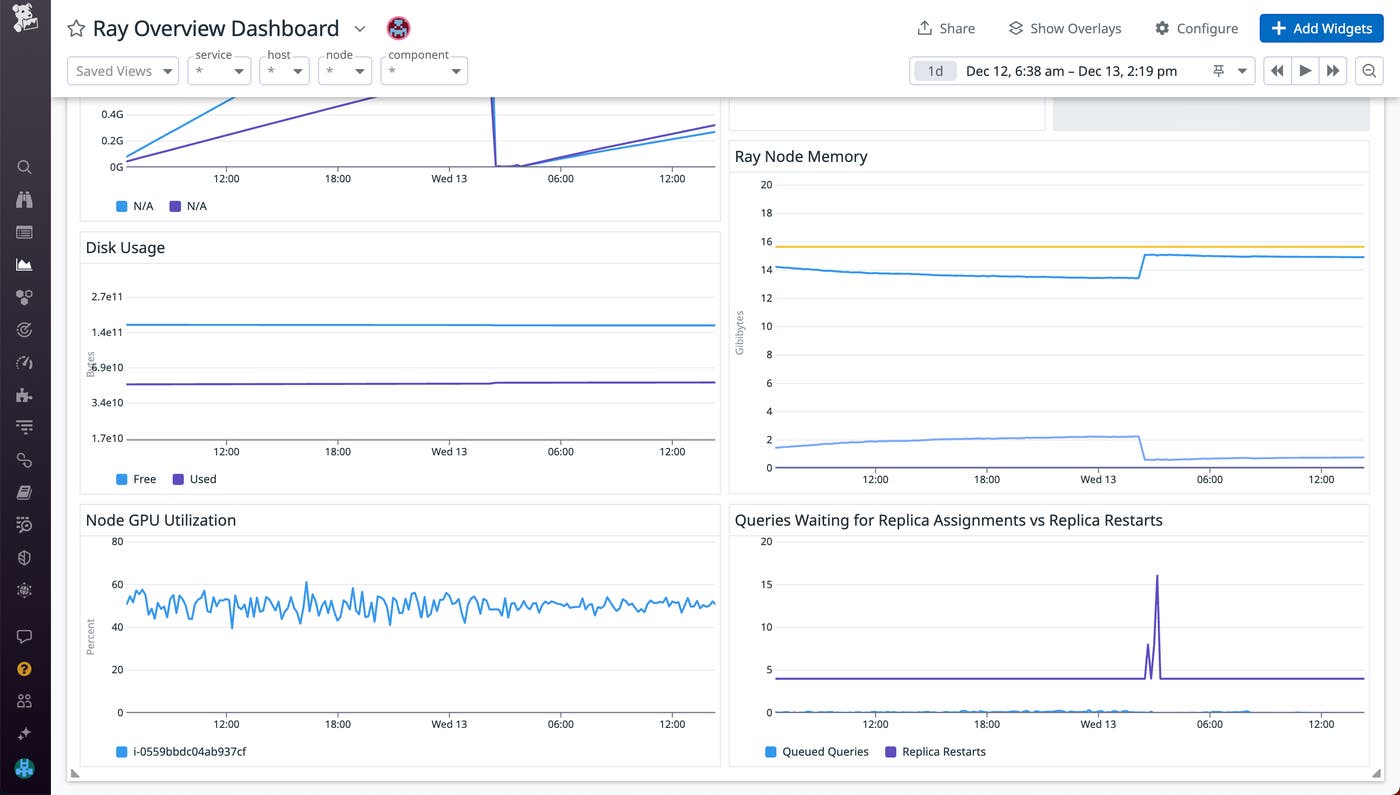
Since you’ll likely be using GPUs for training over large datasets, methods to optimize your GPU utilization will vary depending on the type of workloads you’re running. For instance, if you’re running a batch prediction workload, you can use an actor-based method to reuse model initialization for multiple tasks so that more compute resources are spent on the training workloads rather than on reloading the model.
Alert on Ray issues
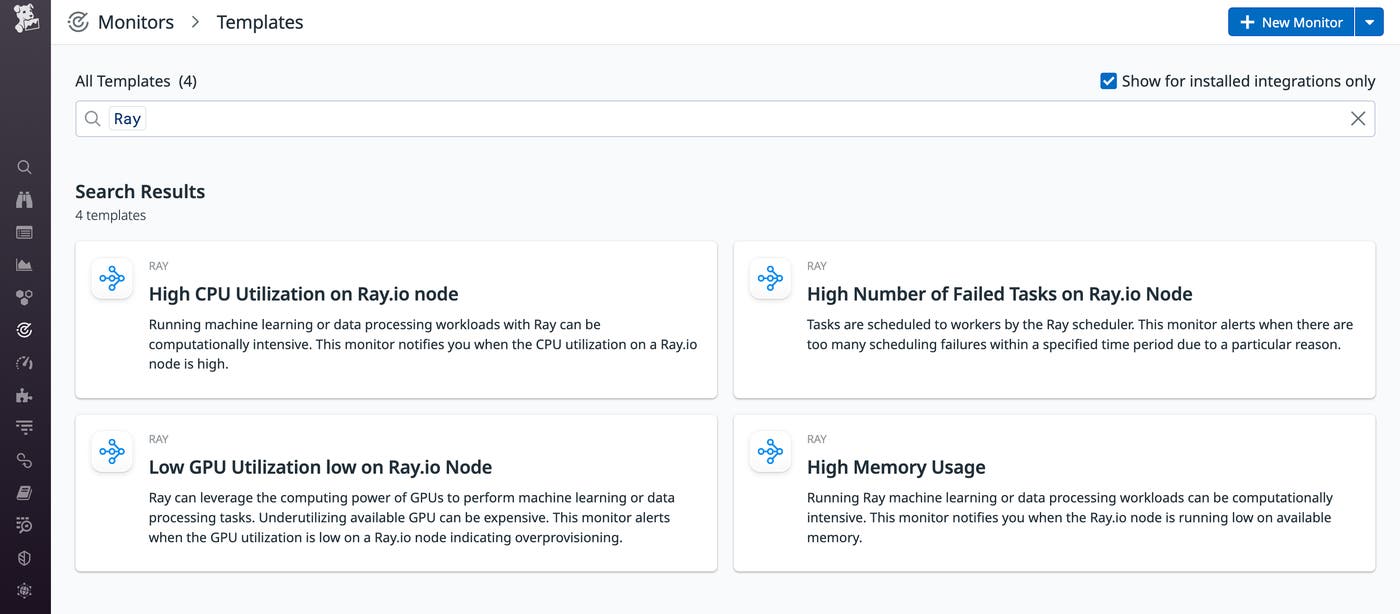
Once you’ve integrated Ray with Datadog, you can configure automated monitors that can help you get ahead of potential issues. Datadog’s integration provides four monitor templates that you can easily adopt to quickly get notified of critical issues in your Ray environment. These monitors have been preconfigured to alert you to:
- A high number of failed tasks
- High memory usage on one or more Ray nodes
- High CPU utilization on one or more Ray nodes
- Low GPU utilization on one or more Ray nodes
Once you enable these monitor templates, you will automatically get notified about critical issues that can degrade or halt workloads if left unchecked (such as processes being OOMKilled). In addition to our OOTB monitors, you can configure custom metric-based or log-based monitors using any of the Ray metrics and logs collected through our integration.
Get started with Ray and Datadog
Datadog’s Ray integration enables you to monitor your Ray clusters as you orchestrate and scale your training workloads. You can monitor these clusters alongside other AI toolkits using additional Datadog integrations relevant to your high-compute workloads, such as TorchServe by PyTorch, OpenAI, and Amazon Bedrock. You can also check out this blog post to learn more about Datadog’s latest AI and ML integrations.
If you don’t already have a Datadog account, you can sign up for a 14-day free trial.
