

PlanetScale is a serverless, MySQL-compatible database platform powered by Vitess. PlanetScale handles database scaling while also providing you with the tools to increase your development velocity, such as branching, non-blocking schema changes, automatic backups, built-in connection pooling, as well as a helpful interface and CLI.
Datadog’s new integration gives you deep visibility into your PlanetScale databases, so you can optimize your usage and costs. In this post, we’ll show you how to:
Monitor queries as you scale
Monitoring queries gives you insight into how users are interacting with your application. Now, you can see which tables in your PlanetScale database are being queried the most, and how much time was spent querying those tables. Datadog’s out-of-the-box dashboard provides a Cumulative Query Count Breakdown graph that helps you visualize the number of queries to each table. In the example below, you can see that the majority of queries are directed at the user table.
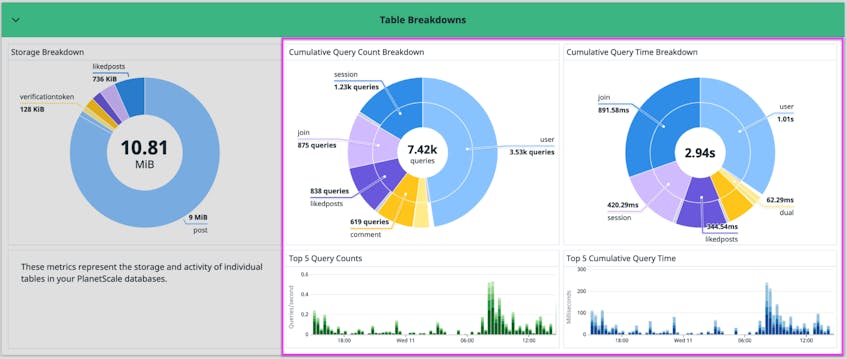
The dashboard also includes a Cumulative Query Time Breakdown graph that shows you how much time was spent querying specific tables. In the graph above, you can see that nearly two thirds of the cumulative query time was spent on the join and user tables. This information can help you make decisions about your database design as you scale up.
Understand your storage bill
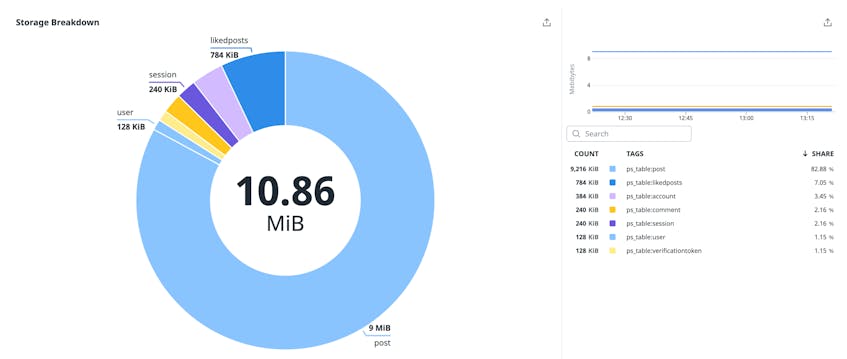
PlanetScale bills users based on storage, reads, and writes. With Datadog’s PlanetScale integration, you can see where the majority of your storage spending is going. The out-of-the-box dashboard includes a Storage Breakdown graph that itemizes your storage by table, so you can see which tables are carrying the heaviest load. In this case, the post table is responsible for the vast majority of your storage. This increased visibility will help you understand storage usage patterns and predict how increases will affect costs.
Track trends in database activity
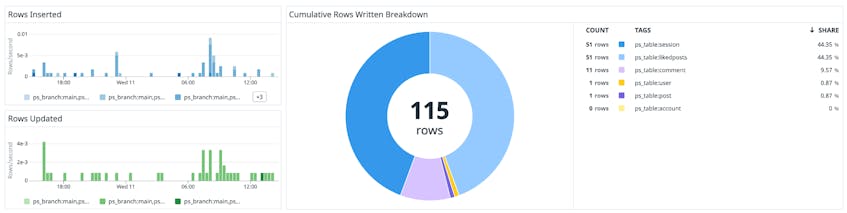
Rows written—which encompasses rows inserted, updated, and deleted—is an important metric to monitor when trying to understand trends in database activity. As shown in the example below, Datadog’s PlanetScale integration breaks down the number of rows written per table, so you can quickly discover trends in activity on certain tables. Additionally, this insight lets you know where changes are happening in your database.
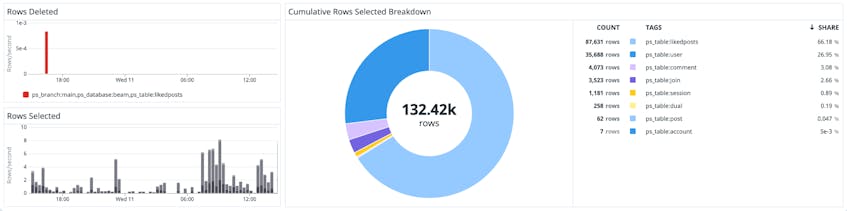
MySQL provides high-level information about the number of rows selected from each database. Let’s say that you query a table of 100 rows as follows:SELECT * WHERE id = 100. Your database will read through 100 rows, select the last one, and return it. It will then increment the rows selected metric by one.
While MySQL gives you this dimensionality per database, the Datadog integration provides a further level of granularity by allowing you to monitor the cumulative number of rows selected per table. As shown in the Cumulative Rows Selected Breakdown graph below, this itemization gives you a sense of the tables from which rows are most commonly selected so you can identify unexpected usage patterns and address any potential issues that might affect your PlanetScale bill.
Monitor PlanetScale with the rest of your stack
The PlanetScale integration is now available in Datadog, giving you increased visibility into your database activity and usage. This additional context will help you get richer context around your bill and understand how to best serve your users’ needs as you scale. Check out our documentation to get started. Or, if you’re new to Datadog, sign up for a 14-day free trial.
