
Monitoring backend issues is critical for ensuring that requests are handled in a timely manner, and validating that your services are accessible to users. But if you’re not tracking client-side errors and events to get visibility into the frontend, you won’t have any idea how often these issues prompt users to refresh the page—or worse, abandon your website altogether. Datadog’s browser logging library helps you detect and debug user-facing issues by enabling you to monitor JavaScript console logs alongside backend logs, metrics, and distributed request traces from your infrastructure and applications.
Track JavaScript console logs and errors from all your users
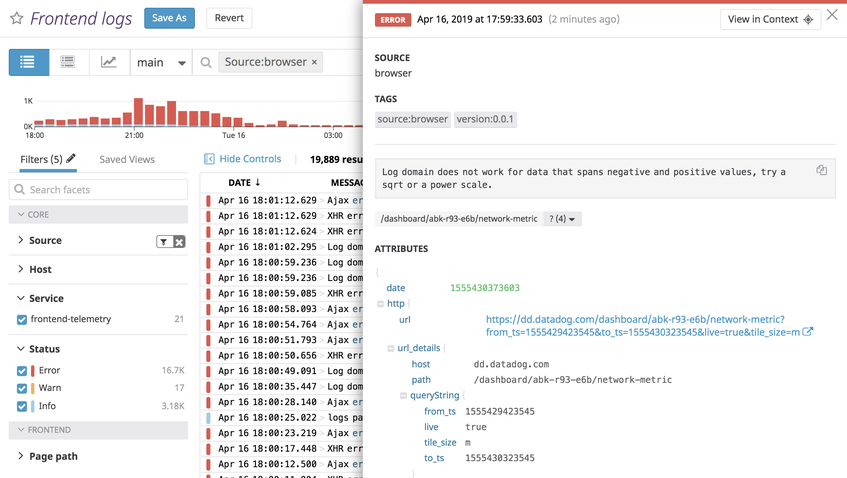
Although some frontend errors may not have any user-facing impact, others could create a frustrating experience for visitors to your website. With Datadog’s client-side logging library, you can automatically track JavaScript console errors in real time, and ensure that these issues don’t impair user experience (e.g., a button doesn’t function properly) or revenue-driving initiatives (e.g., an advertisement fails to load).
JavaScript console error logs include a stack trace that can help you troubleshoot the source of any issue. And because logs are fully integrated with the rest of Datadog, you can explore them in context with all of the other monitoring data you’re already collecting from related services.
Analyze frontend error logs to investigate issues
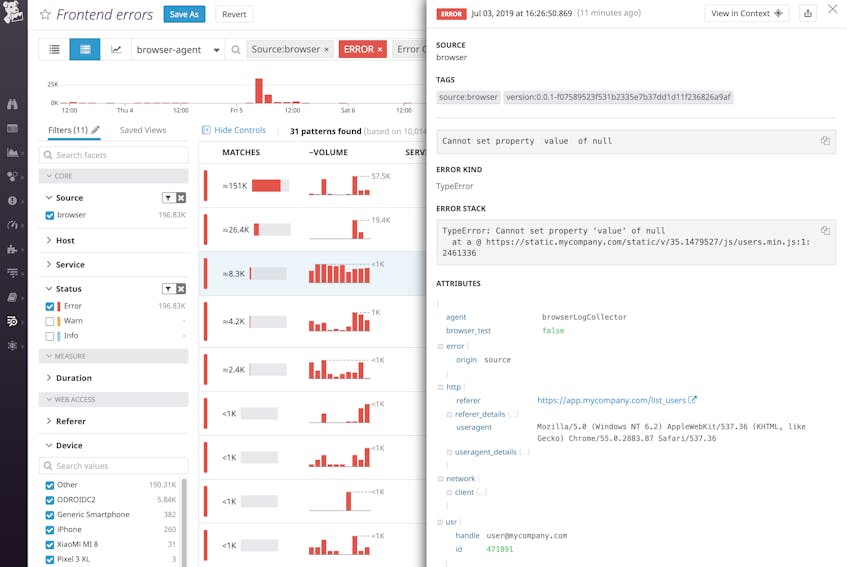
Once you’re collecting and centralizing JavaScript console logs with Datadog, you can analyze them to get deeper insights into when and where frontend errors typically appear—is an error limited to a web browser version, or does it correlate with a specific deployment of this service? Browser logs include key attributes (e.g., browser/user agent, client IP address, and URL path) that you can analyze to determine which types of clients, geographical regions, and endpoints tend to experience the highest rate of errors. With Log Analytics, you can find out if an error is limited to a specific subset of users—based on the browser, device, and OS family they’re running—and use that information to immediately start remediating the problem.
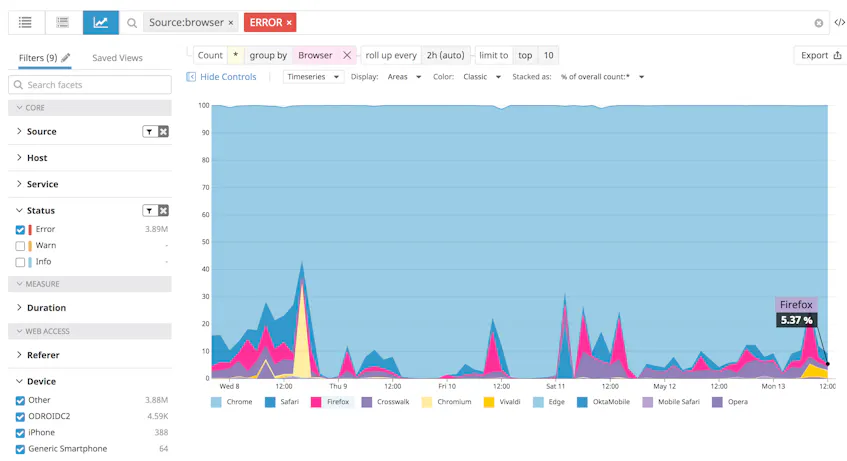
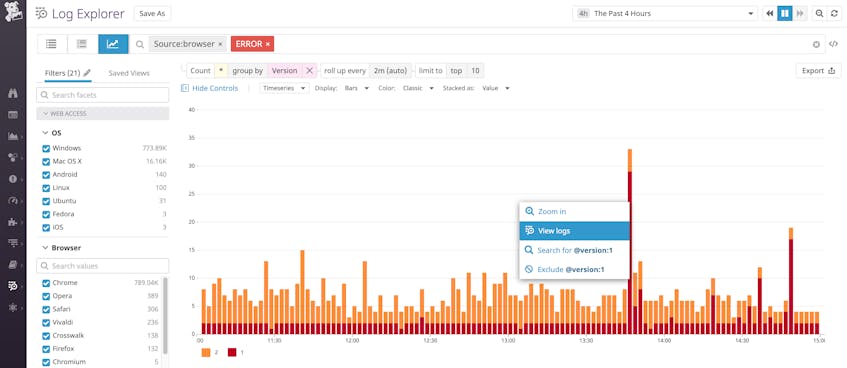
For example, you can create a graph like the one below, to see which browsers submitted the greatest percentage of JavaScript error logs over time.
Log custom user events
In addition to collecting JavaScript console logs, you can log custom events to track any type of activity that is important to your business, whether it’s related to user experience or revenue. For example, you can use custom browser logs to get visibility into client-side latency or to track how users interact with different versions of your website.
Once you’re using Datadog’s JavaScript logging library to add custom attributes to your logs, you can visualize custom user events (e.g., how many ad clicks you get on a given page) or test out different placements of advertisements across multiple pages.
Custom attributes also provide richer context around the JavaScript console logs you’re already collecting. In the screenshot below, you can see that JavaScript errors occur more commonly on version 1 of this application’s UI. To get more details, you can click on the graph to start digging into JavaScript error logs that include a version:1 log attribute, as shown below.
How to collect JavaScript console logs with Datadog
Datadog’s JavaScript logging library automatically optimizes network usage by forwarding logs in bulk to your Datadog account. In this section, we’ll show you how to set up browser log collection with Datadog.
Detect and debug user-facing issues by monitoring your Javascript logs with Datadog.
Create a client token and configure log collection
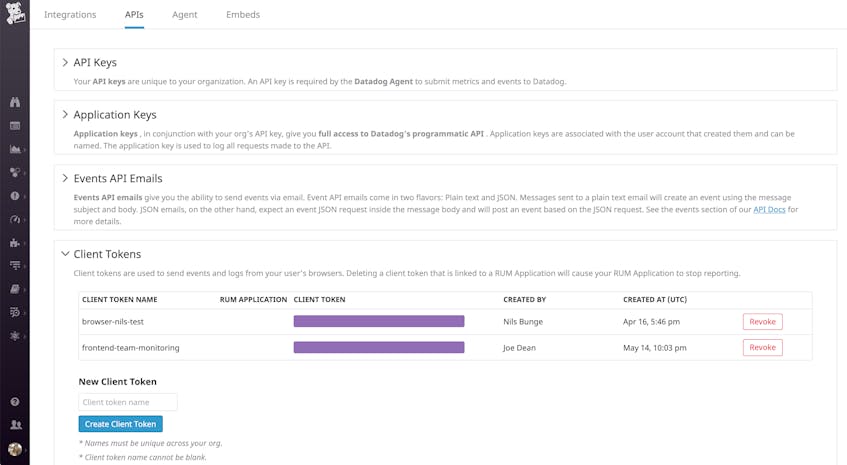
Before you can collect and forward browser logs to Datadog, you will need to generate a client token. Client tokens are specifically designed to allow you to securely send web browser logs to Datadog. You can generate a client token on the API configuration page of your Datadog account, as shown below.
Now you can configure the logger to use this token to forward browser logs to Datadog. The code snippet below demonstrates how you can initialize the Datadog logger and add your client token to your HTML. To automatically collect JavaScript error logs and console logs, set forwardErrorsToLogs to true, as shown below. This will configure the library to automatically collect console.log() messages, as well as any errors that get logged to the console.
<html>
  <head>
    <title>Example to send logs to Datadog</title>
    <script type="text/javascript" src="https://www.datadoghq-browser-agent.com/datadog-logs-us.js"></script>
    <script>
      // Set your client token
      DD_LOGS.init({
        clientToken: '<CLIENT_TOKEN>',
        forwardErrorsToLogs: true,
    });

      // optionally add global metadata attribute--one attribute can be added at a time
      DD_LOGS.addLoggerGlobalContext('request_id', <REQUEST_ID>);
    </script>
   [ … ]
  </head>
[ … ]
</html>
As shown above, you can enrich all of your JavaScript console logs with global metadata, such as a request_id. If you pass this same information to backend logs, you’ll be able to smoothly navigate from any given browser log to view metrics, logs, and traces from the server-side components involved in generating a response to that particular request.
By default, the Datadog logger automatically adds a session_id attribute so you can easily unify any JavaScript console logs that came from the same browser session. Datadog also logs other default attributes to provide more context around each browser log you’re collecting: URL, user agent, and client IP address.
Log custom user events with Datadog
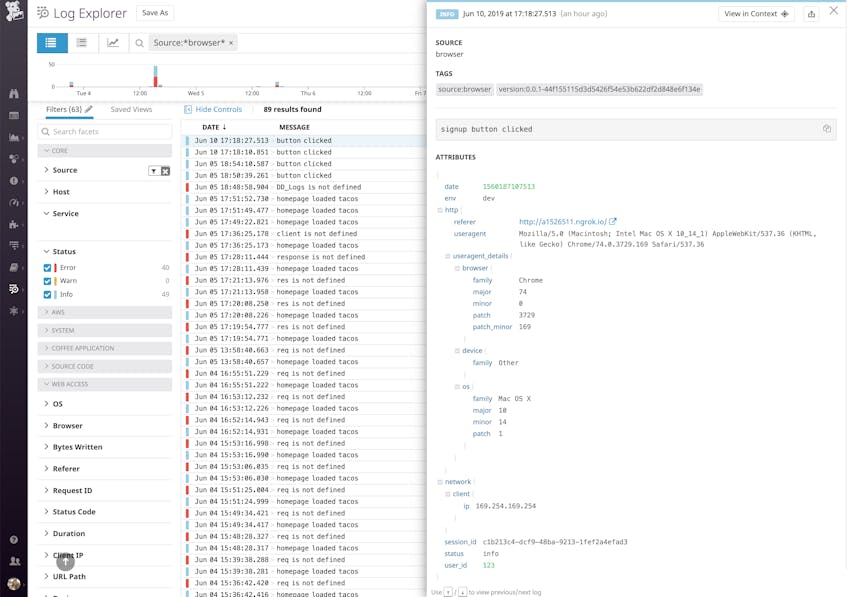
In addition to automatically collecting JavaScript console logs, you can use Datadog’s JavaScript logging library to log any type of custom user activity that’s useful for your business. The following example demonstrates how to configure the logger (DD_LOGS) to capture an INFO-level message that includes the environment and user ID as custom JSON attributes:
DD_LOGS.logger.info('signup button clicked', { env: 'dev', user_id: <USER_ID> })Adding this line allows you to track signup activity—each time the signup button is clicked, Datadog’s JavaScript logging library will generate a log at the INFO status level, with custom attributes (env and user_id). The log will also include default attributes (describing the user agent, browser, session ID, and OS family of the JavaScript client) as well as any global metadata (e.g., request_id) you added to the logger.
Analyze JavaScript logs that matter to your team
If multiple teams are working on different components of the same environment, you can also set up multiple loggers and configure each logger to add metadata that will be useful for analyzing those particular types of logs. The example below shows how you might define two loggers: one for a team that is responsible for testing a new signup functionality, and a second logger to help another team track advertisements:
// test out new signup functionality in dev environment
const signupLogger = DD_LOGS.createLogger('signupLogger')
signupLogger.addContext('team', 'signup')
signupLogger.addContext('env', 'dev')

// track ad revenue in production
const adLogger = DD_LOGS.createLogger('adLogger')
adLogger.addContext('team', 'ads')
adLogger.addContext('env', 'prod')
Each team can then generate its own logs like this:
signupLogger.error('Signup failure occurred')
adLogger.info('Advertisement clicked')
With this setup, teams can quickly find their own logs (which will include logger-specific context as well as global context) and analyze them with the attributes that are most important for their particular use case. To explore these and other options, consult our documentation.
Full-stack visibility with JavaScript logs
JavaScript console logs and custom browser logs provide even deeper context around the real-time data you’re already monitoring with Datadog—everything from infrastructure metrics to APM request traces to web server access logs. And if you’re using Datadog Browser Tests to proactively monitor synthetic requests from various global locations, JavaScript console logs can help you track down the source of user-facing performance issues.
With the addition of JavaScript console logs to the Datadog platform, you can get full-stack visibility across frontend and backend issues, allowing you to continuously improve the availability and performance of your services.
Start monitoring JavaScript console logs and user events
We’re excited to add client-side JavaScript log collection to the Datadog platform, and our teams are hard at work adding even more Real User Monitoring features. Check out our documentation to start collecting browser logs. If you’re not yet using Datadog, sign up for a free trial to monitor browser logs alongside backend logs, metrics, and traces in one platform.
