

Citrix Hypervisor, formerly known as Citrix XenServer, is a type 1 hypervisor that enables organizations to run and manage an entire virtual infrastructure—including VMs, virtual desktops, and virtual applications. Organizations can also use Citrix Hypervisor to optionally host these virtual workloads with higher availability and flexibility by implementing managed server groups called resource pools.
To ensure they can run workloads properly, organizations need deep visibility into the health and performance of their Citrix Hypervisor environments, at multiple layers—including the physical hosts, VMs, resource pools, and the management toolstack. Datadog’s Citrix Hypervisor integration collects key metrics and logs from each of these layers to help you avoid resource bottlenecks and run your workloads efficiently. What’s more, by capturing and viewing these metrics in Datadog, you can conveniently monitor your Citrix Hypervisor environment together with the other aspects of your hardware and software infrastructure.
In this post, we’ll show how you can use Datadog’s Citrix Hypervisor integration to:
- Detect physical host–related bottlenecks
- Monitor resource usage for hosted VMs
- Track session counts in resource pools
- Monitor XAPI memory usage and availability
Detect physical host–related bottlenecks
Monitoring the overall resource utilization of your Citrix Hypervisor hosts can help you determine whether you have supplied adequate resources to the bare-metal environment hosting your virtual workloads. This information can help you stay ahead of any bottlenecks resulting from physical resource saturation, which could threaten the performance of existing workloads and prevent running new ones.
For example, citrix_hypervisor.host.cpu tracks the average percent CPU utilization for a given physical host running a Citrix Hypervisor server installation. Similarly, citrix_hypervisor.host.memory.free_kib can shed light on whether a physical host is fitted with sufficient RAM. If you observe that CPU utilization is surpassing your targets on a physical host, or if the average free RAM is running low, you would likely need to offload at least some of the virtual workloads from that host to other physical hosts. You could potentially also bring these measurements into your desired target ranges by adding more processing power or RAM to the host in question.
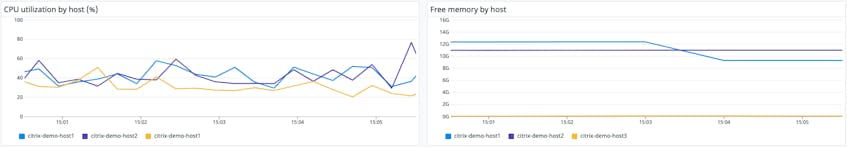
Another important performance factor to monitor on your physical hosts is whether they have enough network capacity. For these observations, use the metric citrix_hypervisor.host.pif.rx, which tracks the average number of kibibytes received per second for all physical interfaces (PIFs) on a given host. More specifically, compare this measurement to your network capacity to determine whether the physical network is approaching saturation. If this is indeed the case, consider upgrading network capacity, for example, by adding adapters to the hosts or upgrading the physical network to support higher connection speeds.
Monitor resource usage for hosted VMs
Monitoring at the physical host level is important, but tracking VM-level metrics is also key to knowing how VMs are performing—and whether they have been allocated the right amount of resources. To this end, Datadog collects utilization metrics from the VMs hosted on your Citrix Hypervisor servers. Monitoring citrix_hypervisor.vm.cpu and citrix_hypervisor.vm.memory across your VMs, for example, can help you understand whether your virtual workloads are memory- or CPU-constrained and require more resources.
Track resource pool session counts
Monitoring your Citrix infrastructure at the pool level is especially useful for virtual desktop infrastructure (VDI) environments. In a VDI scenario, total resource consumption in each resource pool increases proportionally with the number of virtual desktop sessions. Because of this predictability, resource pools are typically sized to support a specific number of simultaneous users.
The fact that user capacity is often pre-established for pools makes tracking the virtual desktop session count at the pool level especially useful. The Citrix Hypervisor integration provides the metric citrix_hypervisor.host.pool.session_count for this purpose. If the number of sessions begins to grow beyond the planned capacity for the pool, you can consider simply adding more hosts to the pool.
Monitor XAPI memory usage and availability
The Citrix Hypervisor management toolstack, or XAPI, controls VM lifecycle operations, host and VM networking, VM storage, user authentication, and resource pool management. These capabilities require the XAPI daemon on each host to have access to ample memory, which is why it’s important to monitor metrics about XAPI memory usage and availability.
With Datadog’s Citrix Hypervisor integration, you can visualize and alert on a number of metrics that track XAPI memory usage and availability. For example, citrix_hypervisor.host.xapi.allocation_kib measures the amount of memory that is allocated to the XAPI daemon overall. To determine free RAM currently available to the XAPI daemon, you can use another metric, citrix_hypervisor.host.xapi.free_memory_kib. The metric citrix_hypervisor.host.xapi.memory_usage_kib, meanwhile, tracks the current amount of XAPI memory usage.
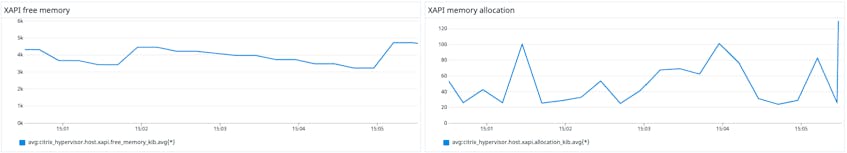
To begin making use of these metrics, you could first register their baseline values during normal behavior for XAPI functions, such as when you provision a new VM or perform a live migration. During this time you will also want to compare free XAPI memory and memory usage against total XAPI-allocated memory to determine baseline values expressed as a percentage. You can also compare these values across physical hosts to help establish your baselines. Later, you could use these values to help diagnose any problems related to XAPI functions. If you see that free memory has fallen below your baseline percentage, for example, you will know to allocate more memory to the control domain that runs the XAPI daemon.
Get started with monitoring your Citrix Hypervisor workloads today
Thanks to Datadog’s Citrix Hypervisor integration, you can now gain visibility into multiple layers of your Citrix Hypervisor environment from the same unified platform where you can monitor more than 700 other services and technologies. To get started using the Citrix Hypervisor integration and its metrics, see the configuration steps in our documentation. And if you’re new to Datadog, you can start a 14-day free trial today.
