

Calico is a versatile networking and security solution that features a plugable dataplane architecture. It supports various technologies, including Iptables, eBPF, Host Network Service (HNS for Windows), and Vector Packet Processing (VPP) for containers, virtual machines, and bare-metal workloads. Users can employ Calico’s network security policies to restrict traffic to and from specific clusters handling customer data and to quickly block malicious IP addresses during external attacks.
Now, Datadog’s Calico integration gives you granular detail into traffic between Kubernetes resources and other workloads, enabling you to ensure that your network policies are properly filtering traffic via iptables. Once you’ve enabled the integration, metrics will begin populating an out-of-the-box dashboard.
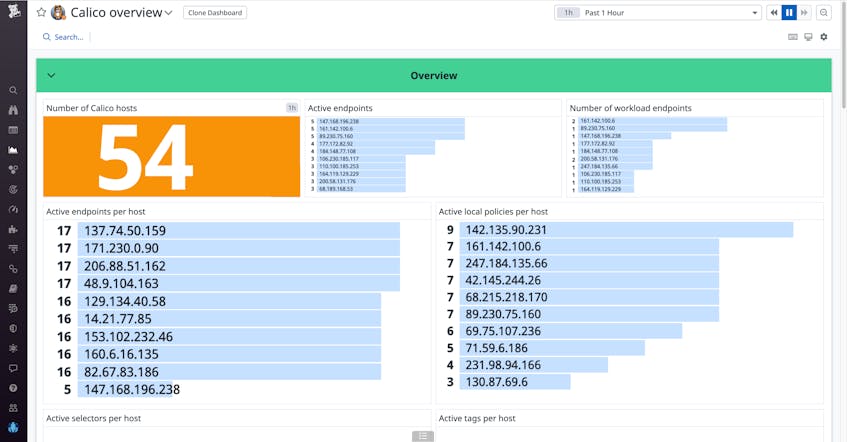
In this post, we will show you how to:
- Track network policies
- Restrict traffic to your host endpoints and workload endpoints
- Monitor errors in your
iptablesandipsets - Leverage Datadog’s Kubernetes integration to get rich context around Calico performance
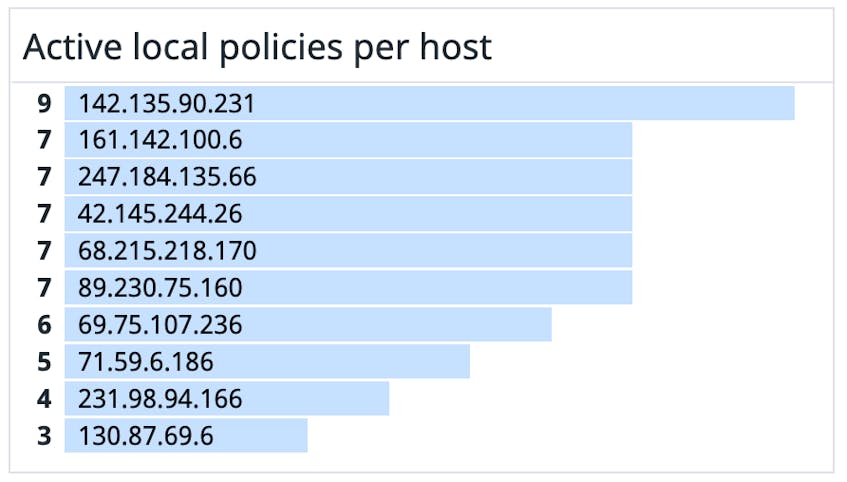
Track Calico network policies
Calico enables you to create two types of network policies to protect pods with sensitive info (customer data, secrets, etc.) from potentially malicious traffic. A Calico network policy (NetworkPolicy) is a resource that enforces a list of restrictions on the traffic sent to and from pods, containers, or VMs in a specific namespace. And a Calico global network policy (GlobalNetworkPolicy is a resource that enforces restrictions on traffic to a selection of hosts, workloads, and pods in all namespaces.
Once you’ve set up our Calico integration, Datadog can automatically alert you to potential threats in your network policies. For instance, an unexpected change in the number of policies could indicate that someone has furtively gained administrative access. In this case, you can search your Calico logs for the IP address that made the change and then quickly block that address from accessing your cluster.
Monitor active host endpoints and workload endpoints
Calico network policies can apply to two types of endpoints. A host endpoint is a resource that interfaces with both NetworkPolicy and GlobalNetworkPolicy to enforce rules on traffic between pods and nodes (or VMs, bare metal, etc.). Calico uses host endpoint labels to determine which network policies or global network policies to enforce. A workload endpoint is an interface that connects a Calico networked container (the workload)
and its host (e.g., a pod).
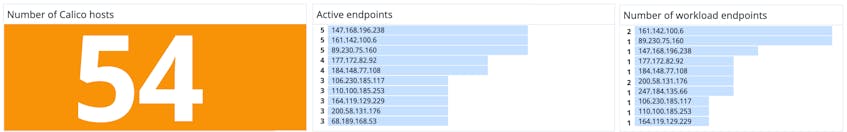
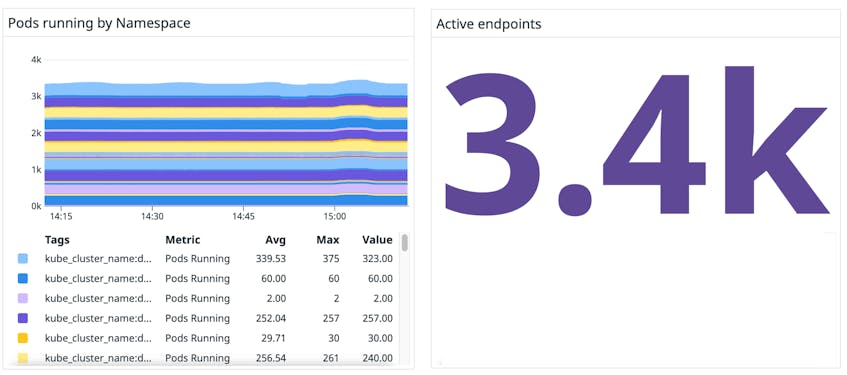
Datadog helps you keep track of endpoints that are exposed to external traffic (active endpoints), which is important for your application’s security. For instance, say you want to secure your cluster against potentially harmful traffic, but you still need to expose a few workload endpoints to traffic from external IP addresses. By default, Calico blocks external traffic to host endpoints even if you haven’t set up a network policy. To selectively enable desired IP addresses to access specific ports, you can create an allow list in your network policy. Once the policy is running, you can monitor endpoint metrics in the dashboard to make sure that the expected number of endpoints are available to network traffic.
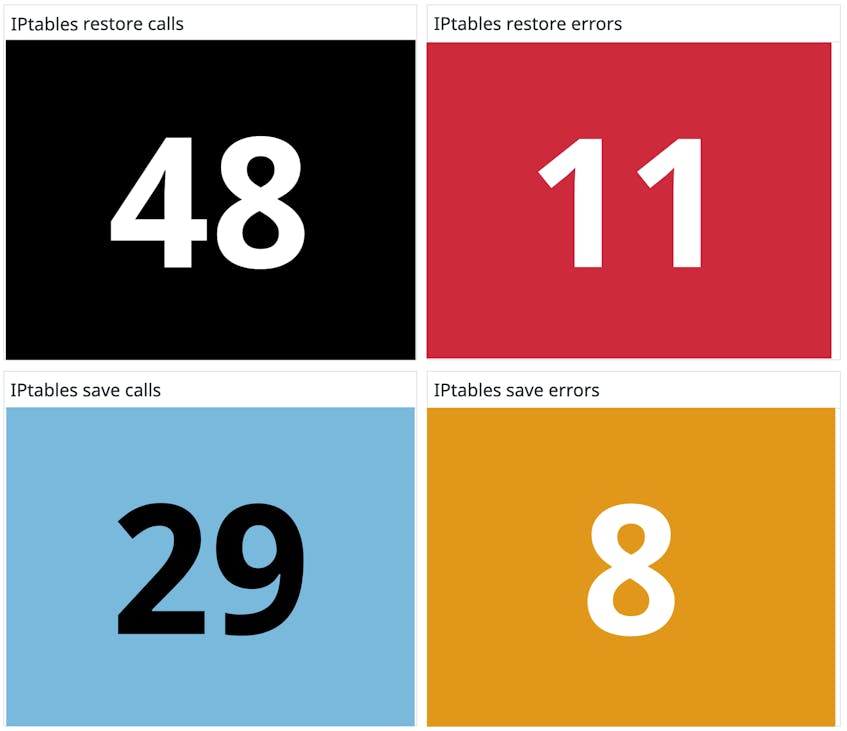
Troubleshoot iptables and ipsets errors
Calico is able to send IP packets without encapsulation by leveraging iptables, a firewall resource that uses tables of rules to govern packet routing between workloads. Calico also utilizes ipsets—a Linux packet processing program that stores IP addresses, networks, (TCP/UDP) port numbers, MAC addresses, and interface names—in tandem with iptables to facilitate firewalled routing.
It’s important to monitor your iptables and ipsets error counts. If you see them incrementing regularly, that may indicate that there is an external factor clashing with Calico. For instance, if you are running a cluster that uses the eBPF dataplane and forget to disable the kube-proxy pods, kube-proxy could be running an iptables rule that conflicts with your Calico policy. If both kube-proxy and Calico are writing iptables rules, this could result in iptables oscillating between the two. To address this, you could switch from eBPF to another dataplane, or, if you need to use eBPF, you can set BPFKubeProxyIptablesCleanupEnabled to false. Alternatively, if you are running a large or growing application, you can consider changing your kube-proxy mode from iptables to ipvs, which will improve your application’s performance as it scales.
Monitor dataplane and ipsets logs
Felix, the brain of Calico, is the main component inside the calico-node daemonset, and it is responsible for the management of all other Calico components that offer networking, network policy, and IP address management capabilities. Calico’s plugable dataplane offers a few different dataplane options, including iptables; IPVS; and the eBPF dataplane, which replaces kube-proxy’s functionality. Datadog’s out-of-the-box dashboard shows you Calico dataplane and ipsets logs, which can provide valuable insight into your infrastructure.
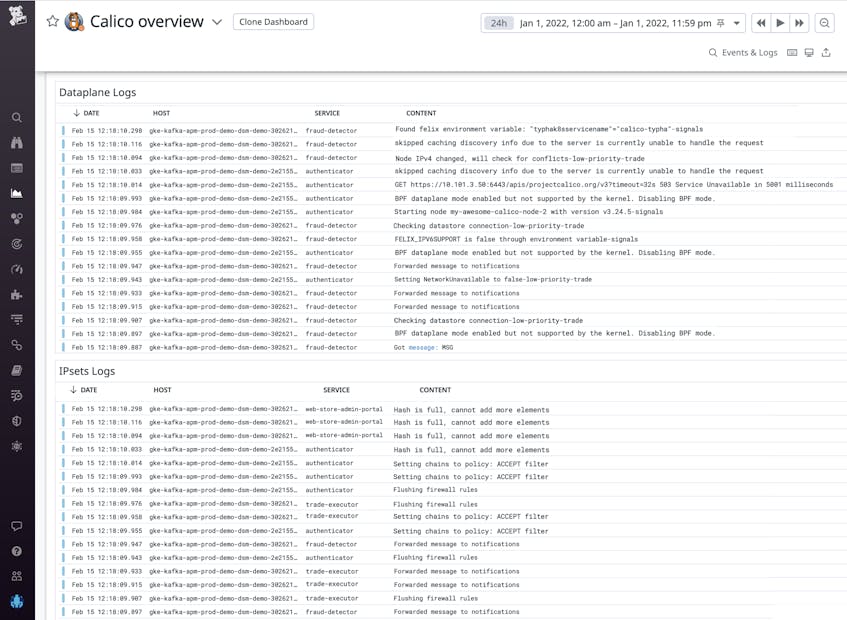
For example, say pods within your cluster running Calico’s eBPF mode are having trouble accessing services. To verify that eBPF mode is correctly enabled, you examine the logs from a calico-node container in the “Dataplane logs” section of the out-of-the-box dashboard. If you see an error log that says BPF dataplane mode enabled but not supported by the kernel. Disabling BPF mode., this lets you know that Calico reverted back to standard dataplane mode, which does not support services. With this information in hand, you can follow the setup instructions to install eBPF mode correctly.
It’s also important to monitor your ipsets logs to stay on top of potential issues. For instance, you might find an error log that states Hash is full, cannot add more elements. This clue is the first step to debugging an elevated IPSet error count. In this case, you can try increasing the IP set’s hash size.
Get rich context around Calico traffic
If you’re using Calico with Kubernetes, you can use data from our Kubernetes integration to help you determine the source of problems and troubleshoot issues more effectively. Kubernetes metrics and logs provide rich context around your Calico traffic so you can understand if problems stem from your Calico networking or your infrastructure. For instance, the number of Calico active endpoints on each node should usually match the number of pods on that node. However, if some pods are host-networked—i.e., they run in the host’s network namespace and therefore bypass Calico entirely—the number of active endpoints differ from the number of pods on the node.
Monitor Calico with the rest of your stack
Datadog’s Calico integration provides real-time visibility into your network policies and endpoints, enabling you to prevent connectivity issues from disrupting your end-user experience and act swiftly to secure your workloads from malicious actors when sensitive data has been compromised. Check out our documentation to start monitoring Calico alongside data from Kubernetes, OpenStack, and more than 700 other technologies. If you’re new to Datadog, sign up for a 14-day free trial.
