Large-scale organizations typically collect and manage millions of logs a day from various services. Within these orgs, many different teams may set up processing pipelines to modify and enrich logs for security monitoring, compliance audits, and DevOps. Datadog Log Pipelines let you ingest logs from your entire stack, parse and enrich them with contextual information, add tags for usage attribution, generate metrics, and quickly identify log anomalies.
But as organizations’ stacks expand to add new architectures and services, they face more complex requirements around log processing. And when new pipelines are continually set up by siloed application, infrastructure, security, and compliance teams, problems crop up—such as gaps in access control and standardization, or logs being modified by conflicting processing rules that can cause downstream issues with monitors, dashboards, and queries.
To help you solve these issues in your org, Datadog Log Management now includes the Scanner, a no-code, streamlined solution that provides real-time inspection of log events as they travel through your different pipelines and processing rules. With the Log Pipeline Scanner, teams can trace log processing flows in order to:
- Discover, diagnose, and remediate processing issues such as unparsed logs, missing tags, or unexpected changes to the log structure
- Ensure their organization is meeting security and compliance requirements
- Remove conflicting or redundant processing rules caused by team silos, and streamline the end-user experience
- Eliminate onboarding bottlenecks by helping users diagnose processing issues without relying on central teams or external support mechanisms
In this post, we’ll discuss how the Log Pipeline Scanner helps your teams more easily investigate the behavior of processing pipelines across your organization, diagnose issues, and prevent snags in their monitoring workflows to avoid lost remediation time.
Quickly identify log processing issues
As we’ve introduced, organizations rely on pipelines to process huge volumes of logs and prepare them for various downstream processes. DevOps, security, and compliance teams must each restructure and enrich logs in different ways to suit their needs. For example, a DevOps team may want to process their unstructured logs for easier dashboarding or searching, and include team information for usage attribution. A security team may want to enrich their IP addresses with geography context to help identify the location of threat actors. Or, a compliance team may want to see special tagging for certain industry compliance requirements to streamline audits.
When these teams are all consuming the same log sources (such as AWS Cloudtrail, VPC Flow logs, or Okta), conflicts in their processing rules can arise. By enabling you to scan your log pipelines in real time and trace specific log events as they pass through different pipelines, the Log Pipeline Scanner helps you track, diagnose, and resolve these issues.
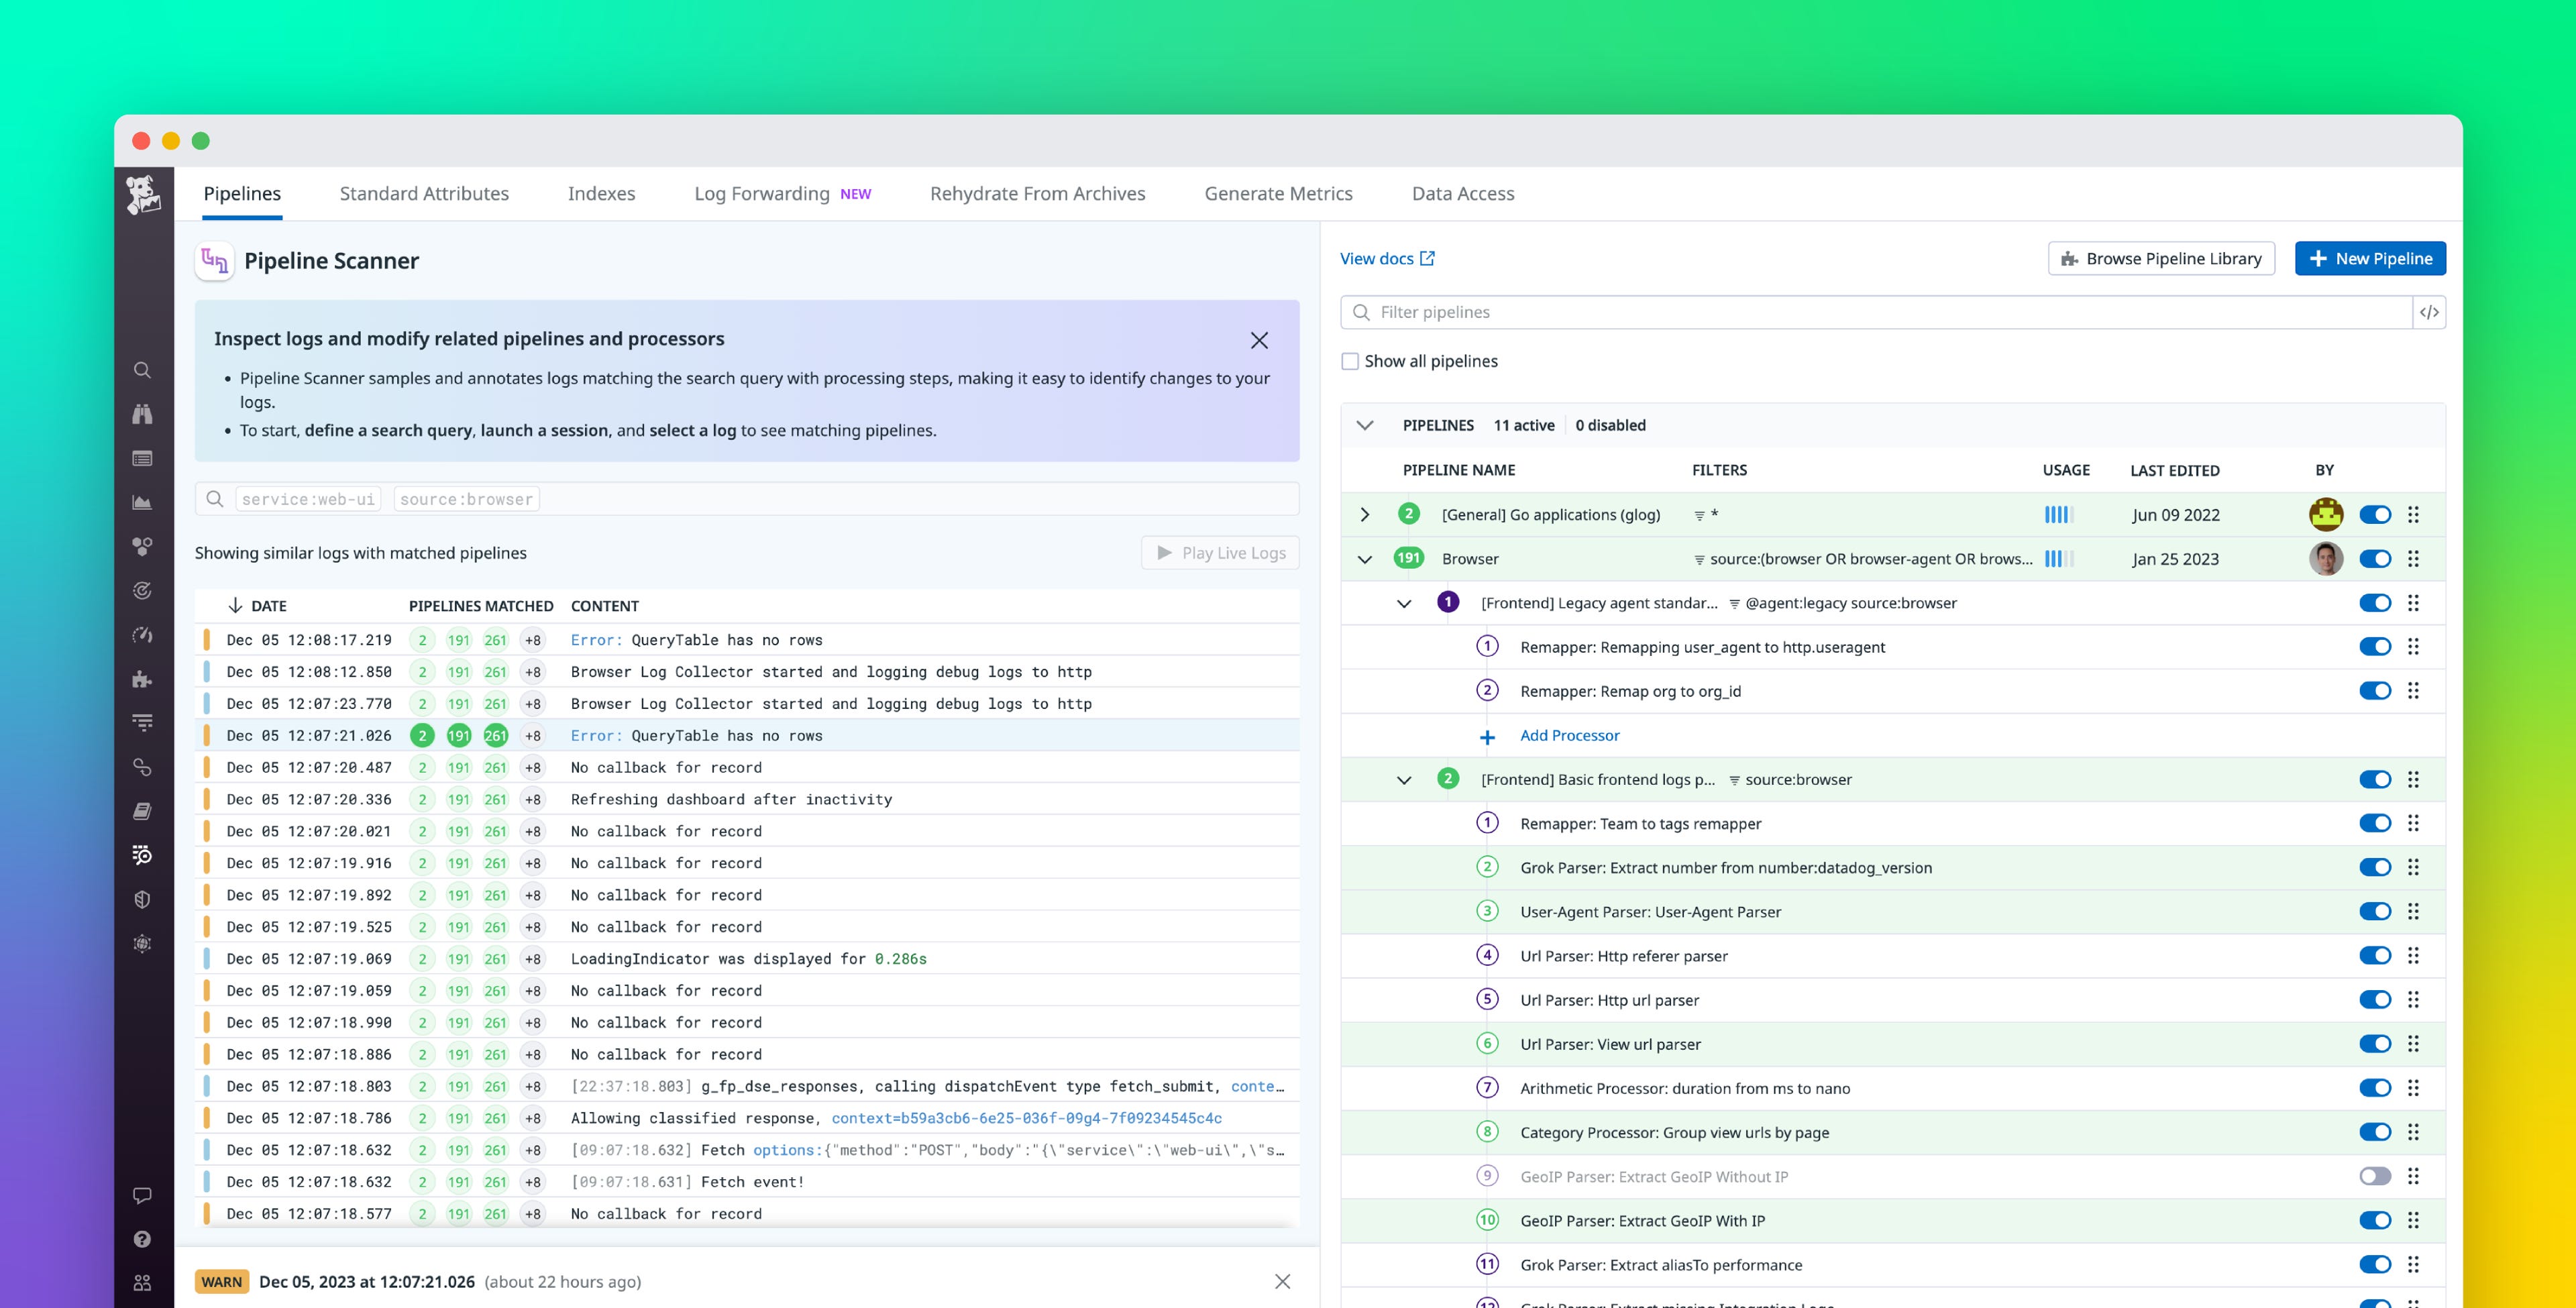
The Log Pipeline Scanner samples and annotates logs with the various processing steps they’re running through. This enables you to inspect relevant processing steps to quickly identify changes being made to its fields. For example, let’s say you’re on a central SRE team that streams logs from CloudWatch for various AWS services, and uses processing pipelines to add tags for cost attribution. You notice that some services are missing cost allocation tags. You can query for these logs in the Log Explorer, open a log, and then pivot to the Log Pipeline Scanner to investigate. The Log Pipeline Scanner shows a live tail of logs with similar attributes to the one you initially highlighted—which are likely to be running through the same pipelines.

You can select a log to see all the pipelines it’s running through, which makes it easy to see how changes to processors are reflected in the corresponding log attributes and tags. For example, you might find that one of the services with no cost attribution has all of its logs running through a processor set up by a different team that clears out corresponding attributes before the pipeline adds its own. If you choose to change the processor to fix the issue with the log syntax, you can continue to use the live tail as new logs are emitted to quickly open recent ones and see if they’re now being processed correctly.

Easily edit your pipelines
The Log Pipeline Scanner provides a consolidated look at all the pipelines applied to your logs, their ownership, and all their constituent steps, so that once you’ve found a processing step that you want to change, it’s easy to fix it. For example, let’s say you notice in a dashboard that a graph containing metrics formed from your custom application logs has stopped showing data. You can use the Log Pipeline Scanner to discover that another pipeline is modifying them to break the queries that the metric relies on. The Log Pipeline Scanner helps you find the exact processing step causing this issue, and identify the pipeline owner so you can request that they take a look.
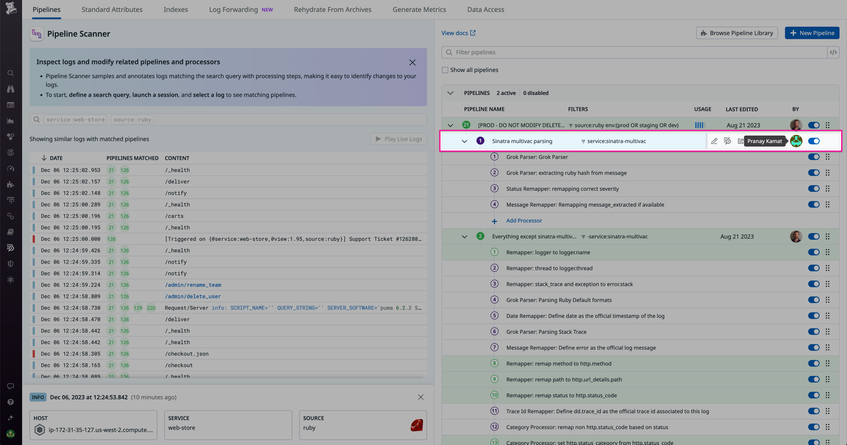
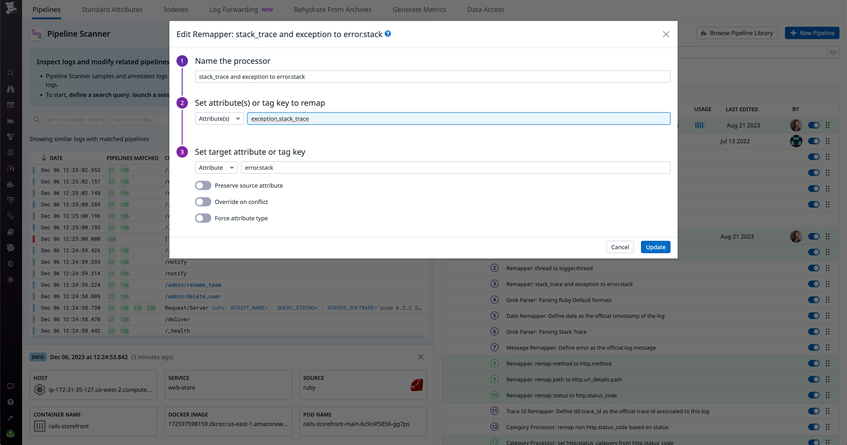
You can click on any log processor step and see how it’s affecting the log fields. Then you (or the pipeline owner) can dive into the configuration and resolve any discrepancies between the processor’s output and your monitoring assets’ expected input. For example, let’s say you find that a remapper is renaming a field to something that doesn’t match the syntax your team is using for their monitors. You can ask the pipeline owner to change this step, or edit your team’s monitors to switch to the new syntax.
For a deeper look at the changes made to this pipeline, you can also use the Pipelines view to quickly pivot to related Audit Trail events. Audit Trail shows you the pipeline’s full change history with detailed user attribution. This way, you can comb through the history to find changes that seem unintentional and follow up with the relevant users.
Get comprehensive visibility into your log pipelines
The Log Pipeline Scanner helps application, security, compliance, and other teams maintain visibility into their log processing. By enabling users to quickly filter through the noise to find the processing steps they need, the Pipelines Scanner ultimately reduces troubleshooting time to resolve issues caused by conflicting or misconfigured pipelines.
The Log Pipeline Scanner is now available for all Log Management customers. For more information about processing pipelines in Datadog Log Management, see our documentation. And to get started with Datadog, sign up for a free trial.
