

In Part 2 of this series, we learned how to access IIS metrics and logs using Windows tools. In this post, we’ll show you a more comprehensive approach to IIS monitoring, one that brings together out-of-the-box dashboards, automated alerts, and log analytics, all in a single platform.
Datadog’s IIS and WMI integrations let you collect most of the key metrics mentioned in Part 1 automatically. For any metrics that IIS surfaces through logs, such as the duration of a request, Datadog can tail IIS log files and process log fields into data without the need for manual querying.
Datadog integrates with technologies that you may be using alongside IIS, like Azure and SQL Server, giving you full visibility into your whole stack.
Set up the Agent
The Datadog Agent is open source software that collects metrics and logs from your IIS hosts, so you can visualize and alert on this data in one central platform. To install the Agent, navigate to the Agent Installation page of your Datadog account and download the installer for the latest Windows version (sign up for a free trial if you’d like to follow along with the rest of this post).
If you prefer a graphical interface, you can execute the datadog-agent-6-latest.amd64.msi file and follow the instructions to start customizing your Agent. And if you prefer to install the Agent from a terminal window, the installation page includes a command you can copy, paste, and execute.
The Agent looks for configuration options within several YAML files. You can edit these files either through a local browser-based GUI at http://127.0.0.1:5002, or by editing the configuration files directly. To start, stop, or restart the Agent, or to show its status, you can use either the GUI or the command line.
Configure IIS monitoring
Datadog’s IIS integration queries the Web Service performance counters automatically and sends the results to Datadog. The Web Service (Win32_PerfFormattedData_W3SVC_WebService) performance counter class collects information from the World Wide Web Publishing Service (as discussed in Part 1). See Part 2 for instructions on how to make sure the class is installed on your host.
You can enable the IIS integration by creating a configuration file either manually or through the Datadog Agent GUI. To create a configuration file through the GUI, navigate to the “Checks” tab, choose “Manage Checks,” and select the iis check from the “Add a Check” menu. You can also manually create a conf.yaml file in C:\ProgramData\Datadog\conf.d\iis.d, using our example as a reference.
The content of iis.d\conf.yaml will resemble the following.
conf.yaml
init_config:


instances:
  - host: .
    tags:
      - service:<YOUR_SERVICE_NAME>
    sites:
      - <YOUR_SITE_URL>
In this example, the host tag is set to ., which instructs the Agent to query metrics locally. You can specify a remote host by indicating the name of a server as the value of host and setting a username and password (see our documentation).
If you would like to monitor multiple IIS sites, you can list the base URL of each site under the sites key (recall from Part 1 that the Web Service counter set generates its metrics by site). You can also list the name of the site, such as my-site, in place of the URL. The Agent will automatically tag each site you are monitoring with a site:<YOUR_SITE_URL> tag.
Note that if you are using IIS 6 or 7, you will have to set the is_2008 parameter to true in order to collect the TotalBytesTransferred metric, as these earlier versions of IIS report the metric as TotalBytesTransfered with a single r.
To put the new configuration into effect, restart the Agent using the command:
"C:\Program Files\Datadog\Datadog Agent\embedded\agent.exe" restart-serviceYou can confirm that the Agent is reporting metrics by opening the Datadog Agent GUI, clicking “Status” on the sidebar, and selecting “Collector.” You can also run the following command:
"C:\Program Files\Datadog\Datadog Agent\embedded\agent.exe" statusYou should see something similar to the following under the Running Checks header:
iis
Total Runs: 2
Metrics: 21, Total Metrics: 42
Events: 0, Total Events: 0
Service Checks: 2, Total Service Checks: 4
Set up the WMI integration
Datadog integrates with more than 700 other popular technologies, meaning you can monitor your entire web stack in one place. The WMI integration allows you to pull data from any formatted performance counters, including counters for IIS worker processes.
To enable the WMI check on the Datadog Agent, create a configuration file (either through the GUI or at C:\ProgramData\Datadog\conf.d\wmi_check.d\conf.yaml), and add the performance counter attributes that you’d like the Agent to query. The configuration YAML below names three custom metrics, each of which queries an instance of the object Win32_PerfFormattedData_PerfProc_Process for each IIS worker process.
conf.yaml
init_config:

[...]

instances:

  - class: Win32_PerfFormattedData_PerfProc_Process
    metrics:
      - [PercentProcessorTime, proc.cpu_pct, gauge]
      - [WorkingSet, proc.working_set, gauge]
      - [ElapsedTime, proc.elapsed_time, gauge]
    tag_by: Name
    filters:
      - Name: w3wp%
The value of class is the name of a WMI class, which you can obtain through PowerShell (as explained in Part 2). Each custom metric is an array with three elements: the name of the performance counter, the custom name you’d like Datadog to report for the metric, and the metric’s type. The tag_by key lets us choose a property from the WMI class to use as a tagging prefix. The example above will tag each metric with name:<WORKER_PROCESS_NAME>. We can then use values within the filters section to target certain instances of the WMI class. In the example above, the Agent will only query instances with a Name property that includes the characters, w3wp—our IIS worker processes. (The % is a wildcard indicating any number of characters.)
Graph your whole IIS deployment in one place
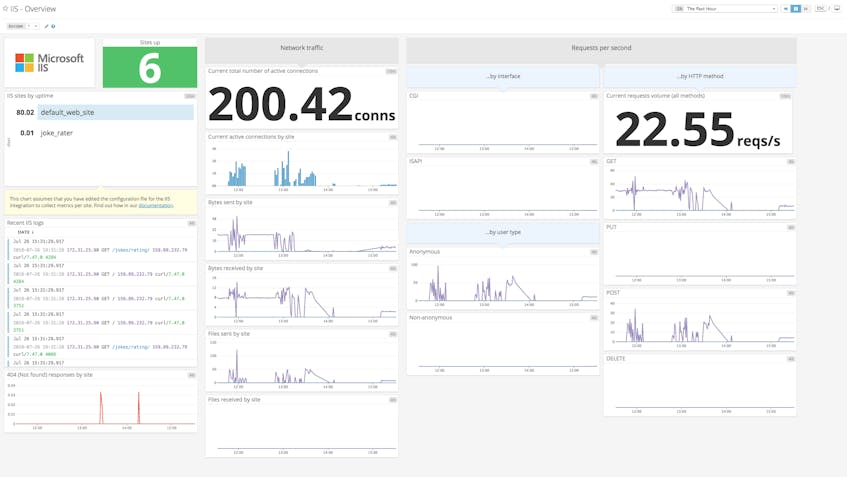
Once you’ve configured the IIS integration, you can quickly visualize the health and performance of IIS using an out-of-the-box dashboard. Clone the default IIS dashboard to use as a template, or create a new dashboard from scratch.
IIS runs across multiple parts of your Windows system, from worker processes to HTTP.sys and the WWW Service, so it’s important to keep an eye on metrics at the level of sites, processes, and system-level resource use. Datadog dashboards make it possible to visualize, compare, and correlate metrics from all of these components in one place. And because log management is built into the same platform, you can quickly get more context around potential issues by navigating from any timeseries graph to view logs from the same point in time.
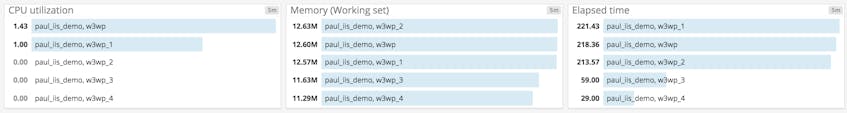
With the WMI integration, you can monitor your IIS worker processes individually. This is helpful when you want to compare certain metrics across each of your worker process, as shown below with each of the three custom metrics we defined earler. You can see whether any one worker is using an unusual percentage of CPU or memory, and whether any worker process has been killed or spawned recently. And with outlier detection, Datadog can alert you automatically when a single worker process starts to behave differently from the others, for instance if it hangs, crashes, or starts to leak memory.
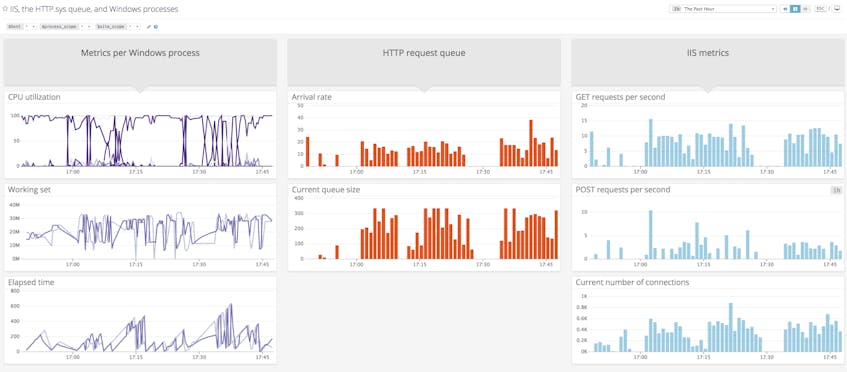
The custom dashboard below displays metrics from three different sources, all of which sit at the foundation of an IIS environment. Two of these sources, the HTTP.sys request queue and a set of Windows processes, report metrics through the WMI integration. The third source is the Web Service performance counter, which provides metrics for the IIS integration. This dashboard makes it easy to see how incoming request traffic correlates with queue volume and the health of IIS workers, and helps you identify bottlenecks.
IIS log management with Datadog
Since several key IIS metrics are only available from logs, it’s important to collect and analyze your logs in order to get full visibility into your deployment. You can configure the Datadog Agent to collect logs from IIS, parse them, and send them to Datadog. Once Datadog is ingesting your logs, you can use that data to identify trends and get alerted to IIS performance issues.
Configure IIS log collection
To start collecting IIS logs, you need to enable log collection within the Agent. Find the Agent configuration file, either by opening the Agent GUI and clicking “Settings,” or by opening the configuration file at C:\ProgramData\Datadog\datadog.yaml, and set logs_enabled to true.
Then instruct the Agent where and how to collect IIS logs. Uncomment the logs section of the IIS integration configuration file you created above at C:\ProgramData\Datadog\conf.d\iis.d\conf.yaml:
conf.yaml
logs:
  - type: file
    path: C:\inetpub\logs\LogFiles\W3SVC1\u_ex*
    service: <YOUR_SERVICE_NAME>
    source: iis
Change the value of path if your logs are written to a different directory within your system. You’ll also want to change the value of service to the one you specified when configuring the instances section of conf.yaml. The service tag allows you to associate metrics, logs, and request traces more easily. Set source to iis to enable the processing pipeline and facets that are built into Datadog’s IIS log integration.
Restart the Agent to apply the new configuration:
"C:\Program Files\Datadog\Datadog Agent\embedded\agent.exe" restart-serviceWhen you check the Agent status (this time under the “General” tab if you are using the GUI, or with the status command we used earlier), you should see something like the following:
Logs Agent


iis
        Type: file
        Path: <YOUR_LOG_FILE_PATH>
        Status: OK
        Inputs: <YOUR_LOG_FILES>
Customize the IIS log processing pipeline
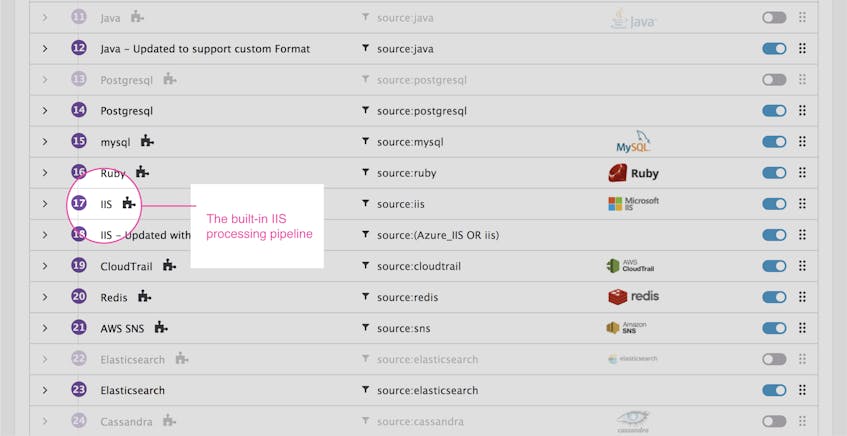
When the Agent sends IIS logs to Datadog, a built-in processing pipeline parses and enriches them into structured data, which you can use for graphing and analysis. You’ll want to make sure the pipeline is enabled. In Datadog, navigate to the Pipelines view, find the IIS pipeline, and click the switch.
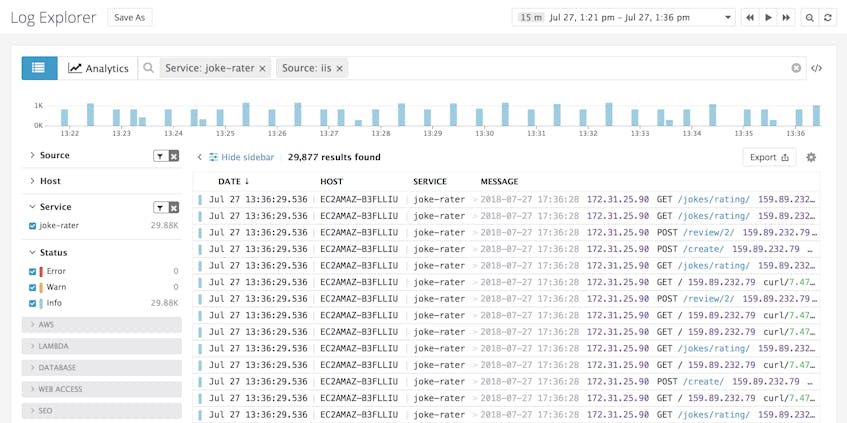
You should start to see your IIS logs populating Datadog’s Log Explorer view. Here, you can set the Log Explorer to display only IIS logs for your application. Use the sidebar or enter a query in the search bar to filter by source:iis and service:<YOUR_SERVICE_NAME>.
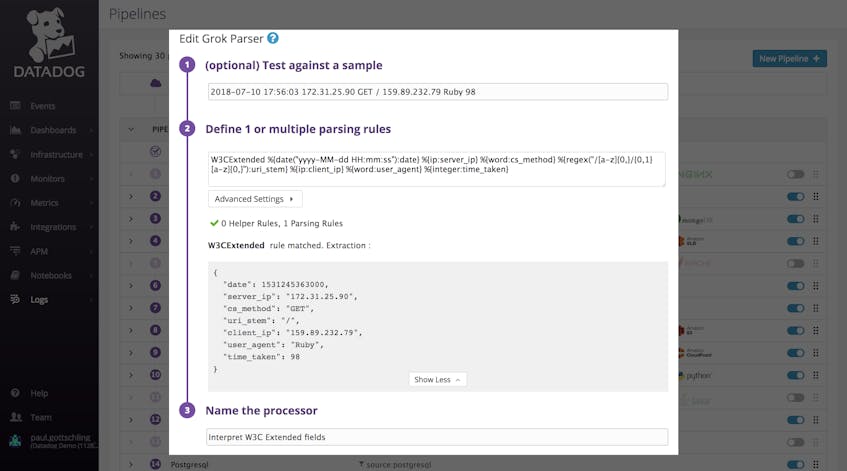
Since IIS gives you leeway to add and remove fields from your web service logs, you can clone and customize Datadog’s IIS log processing pipeline to ensure that it processes your logs correctly. Click the dropdown arrow next to the name of your cloned pipeline, and click the editing icon for one of the steps.
In the example below, we’re creating a Grok Parser to process the W3C Extended log format and extract key attributes. If you paste an arbitrary log line from one of your log files into step one, you can see the output of your parsing rules at the bottom of step two. Parsing logs into structured attributes makes it possible to perform analytics, as we’ll show next.
Graph and analyze IIS log data
With Datadog, you can analyze log data that you collect, graph it over time, and aggregate it by any facet, whether it’s URI stem, HTTP request method, or any other log-based metric we introduced in Part 1.
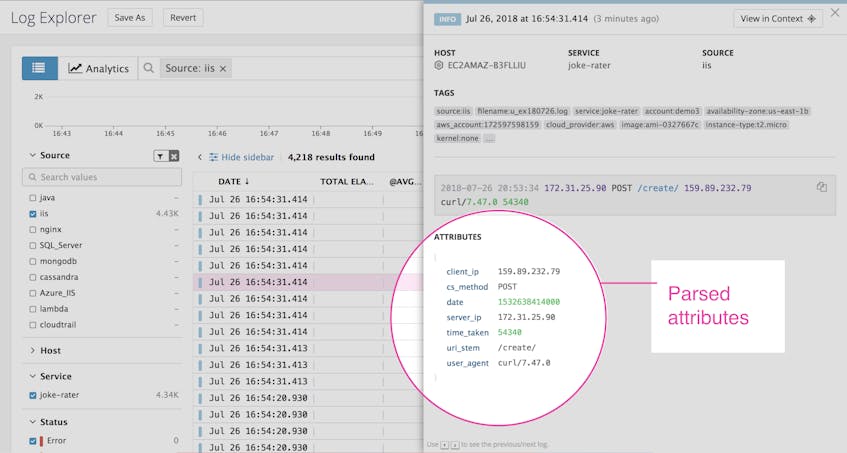
When you click on a log within the Log Explorer, you’ll see all of the attributes that Datadog has extracted from the raw log data.
If you want to graph and query log attributes, you can turn them into measures or facets. Click any key in the list of attributes, and you’ll see the option to turn that key into either a facet or a measure. Facets let you aggregate, search, and filter log data (such as URL endpoint or HTTP status code). Measures are numerical values that are similar to Datadog metrics (such as response latency). In this example (below), we can create a facet for uri_stem, and a measure for time_taken.
We can then use these measures and facets to perform analytics. The example below graphs the average value of “Time Taken” by URI endpoint across all logs collected from the joke-rater service. We can see that requests to the URI path /jokes/rating/ (represented by the yellow line) have exhibited the highest latency over the past 15 minutes.

You can easily add any Log Analytics graph to a timeboard by clicking “Export” and choosing a timeboard, as shown below. Note that at the time of publication, this functionality is still in beta.
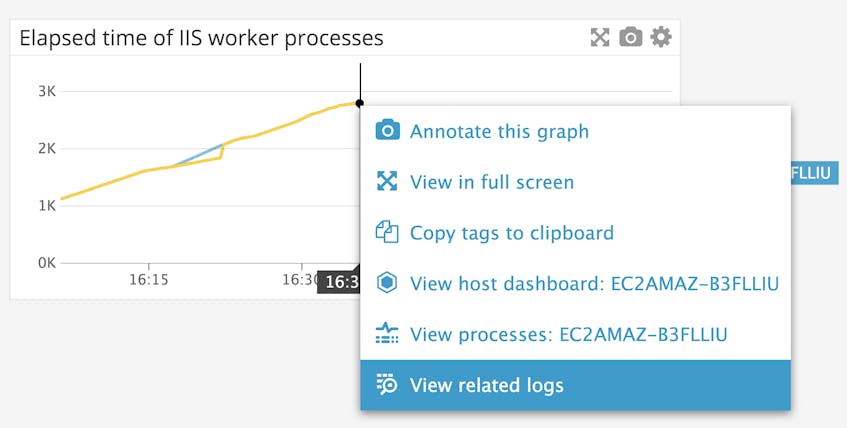
And if you’ve noticed something unusual on a timeboard—for example, if the ElapsedTime of an IIS worker process has stopped incrementing—you can click the timeseries graph to view related logs collected from that host and process, scoped to that particular time period.
Automated alerts for IIS monitoring
Throughout this post, we’ve shown how Datadog can help you monitor metrics and logs from your IIS deployment in one place, even if it spans multiple sites and worker processes. You can also configure Datadog to alert you automatically when IIS runs into health and performance issues. For example, Datadog can notify you when IIS has recycled an application pool, is sending a high number of requests to the queue, or is otherwise behaving unexpectedly.
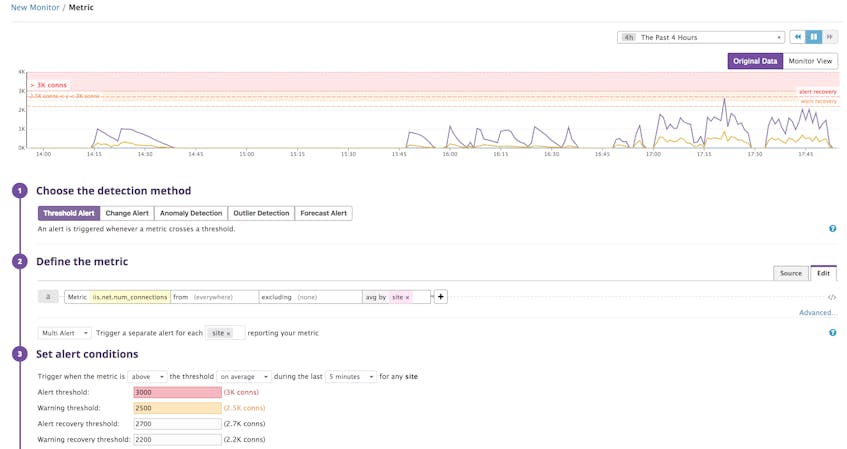
An important metric to alert on is the number of active connections, as an unusually high number can saturate request queues and introduce more CPU load on your worker processes. A spike in connections may even indicate a potential security threat. You can create an alert to get notified when the number of active IIS connections (iis.net.num_connections) to any particular site exceeds a threshold, as shown in the example below.
You can also alert on data from your IIS logs, such as the latency (time-taken) of a request. In the example below, we set up a log alert to notify us when more than 1,800 requests record a time-taken of more than 10 milliseconds over a five-minute interval.

Get started with IIS monitoring
In this post, we’ve shown you how to get full visibility into your IIS deployment with Datadog. Once you’ve set up IIS monitoring with Datadog, you’ll be able to visualize the key metrics discussed in Part 1 alongside data from more than 700 other technologies, all in one place. We’ve also shown you how to use Datadog to parse your IIS logs without any need for manual querying, and how to graph and analyze your IIS logs to gather insights. Finally, we’ve explained how to set up alerts to notify your team automatically when there’s an issue with IIS.
If you’re new to Datadog and want to bring your IIS logs and metrics into a centralized platform for graphing, analysis, and alerting, here’s a free trial to get you started.
Source Markdown for this post is available on GitHub. Questions, corrections, additions, etc.? Please let us know.
