---
title: "How to collect Google Compute Engine metrics"
description: "Learn how to collect key GCE metrics."
author: "Evan Mouzakitis"
date: 2017-03-08
tags: ["infrastructure monitoring", "google cloud", "google compute engine", "gcp gce", "compute"]
blog_type_id: the-monitor
locale: en
---
*This post is part 2 of a 3-part series on monitoring the health and performance of virtual machines in Google Compute Engine (GCE). *[*Part 1*](https://www.datadoghq.com/blog/monitoring-google-compute-engine-performance.md)* details key GCE metrics to monitor, this post covers data collection using Google tools, and *[*part 3*](https://www.datadoghq.com/blog/monitor-google-compute-engine-with-datadog.md)* explains how to monitor GCE with Datadog.*
Google provides a few methods by which you can surface and collect most of the metrics mentioned in [part 1](https://www.datadoghq.com/blog/monitoring-google-compute-engine-performance.md) of this series. In this post we will explore how you can access Google Compute Engine metrics, using standard tools that Google provides:
- [Google Cloud Platform’s Stackdriver monitoring API](#monitoring-api)
- [The gcloud command line tool](#gcloud)
- [Stackdriver's GUI](#stackdriver)
## Monitoring API
Google Cloud Platform's [Stackdriver monitoring API](https://cloud.google.com/monitoring/api/v3/) is the most full-featured method for extracting platform performance metrics from GCE. You can query the API using common tools typically found on most operating systems, including `wget` and `curl`.
Before you can use the Stackdriver API, you must first authenticate using OAuth2.0, which is a multi-step process. Below we've outlined two methods by which you can obtain a token to use for API calls:
- [Service account authorization](#auth-option-1-service-account-authorization)
- [User account authorization](#auth-option-2-user-account-authorization)
User account authorization is great for interactive experimentation, but service account is the recommended auth type if you plan to use the REST API in a production environment. If you want to skip the auth process for now, you can still follow along in [Google's API Explorer](https://developers.google.com/apis-explorer/#p/monitoring/v3/monitoring.projects.timeSeries.list).
### Auth option 1: Service account authorization
By default, all Compute projects come pre-configured with the *Compute Engine default service account*, whose email invariably follows this format: `[PROJECT_NUMBER]-compute@developer.gserviceaccount.com`. This service account has the authorization scopes you need to query the Stackdriver API (and much more). To follow along, you can use the default service account, or you can easily create a new service account and use it instead, so long as you create it with a **Project Owner**, **Project Editor**, or **Project Viewer** role.
#### Create service account key
Once you select a service account, you will need to create a service account key to use in obtaining the OAuth token needed to interact with the API. Navigate to the [service accounts page](https://console.cloud.google.com/iam-admin/serviceaccounts/) in the console and select your project.
Next, find the *Compute Engine default service account* (or the new service account you've created for this purpose), click the hamburger menu (three stacked dots), select **Create key**, and choose **JSON** as the key type. Then, download and save the key.

With credentials in hand, you are ready to construct a [JSON Web Token (JWT)](https://en.wikipedia.org/wiki/JSON_Web_Token) to request an API access token.
Creating a JWT is a multistep process which is easily automated. You can either [manually construct the JWT](https://developers.google.com/identity/protocols/OAuth2ServiceAccount#creatingjwt), or [download this helper script (Python)](https://gist.github.com/vagelim/535be2814b504f9e8252a5e8cecb7077) to automatically request an API access token using your downloaded credentials. Once you have a token, you're ready to [make an API call](#query-the-api).
### Auth option 2: User account authorization
First, navigate to the [API Manager](https://console.cloud.google.com/apis/dashboard) dashboard for your project and click **Credentials**.
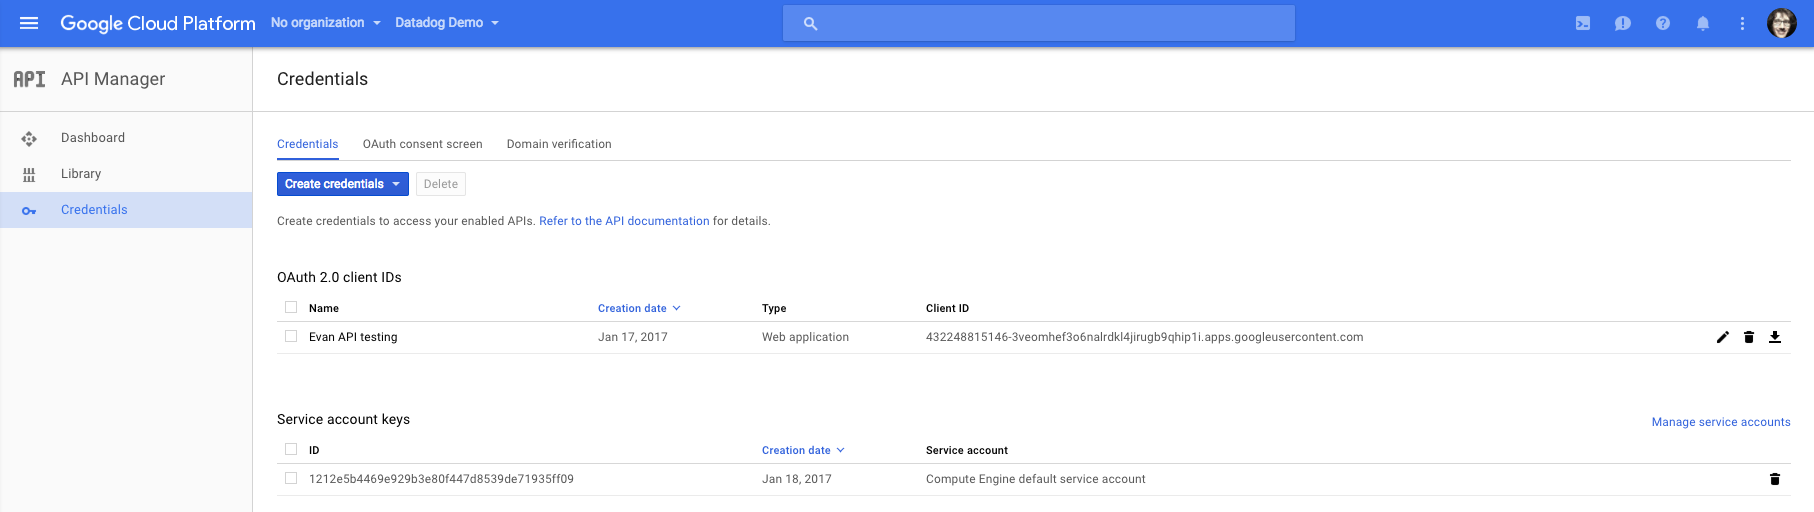
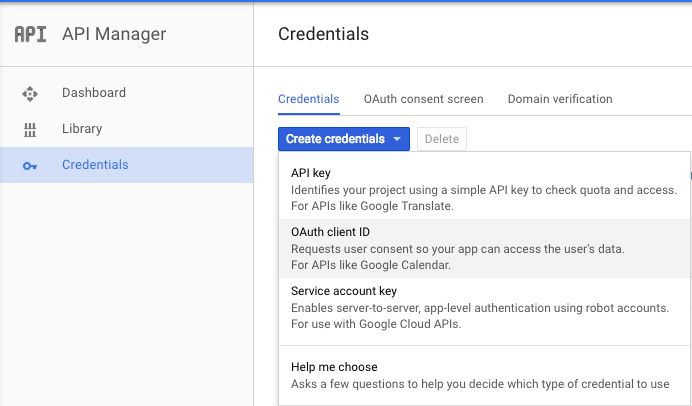
Next, click the blue **Create credentials** button, and from the dropdown that follows, select **Oauth client ID**.
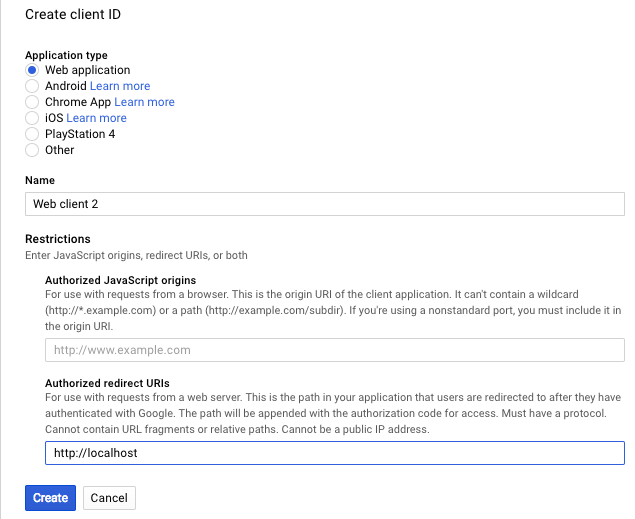
On the next screen, click the **Web application** radio button, enter `http://localhost` under *Authorized redirect URIs*, and click **Create**.
Copy your client ID and client secret from the popup and store them in a safe, encrypted place.
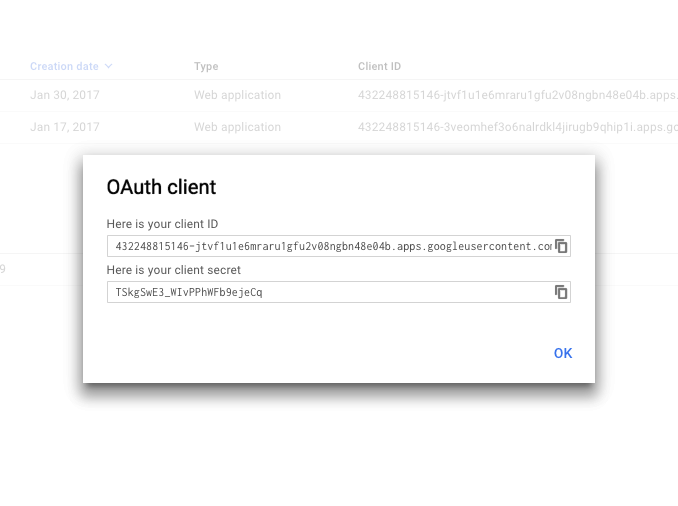
With your client ID in hand, you are ready to construct an HTTPS request that will enable your Google account to access GCE metrics.
The request below has been split into distinct parts for readability; you must concatenate all the parts together before executing in a browser:
```text
https://accounts.google.com/o/oauth2/v2/auth # Base URL for authorization
?redirect_uri=http://localhost # Redirect URL set in credential creation
&response_type=token # Type of response we want back from Google
&client_id=xx-xx.apps.googleusercontent.com # The client ID copied at credential creation
&scope=https://www.googleapis.com/auth/monitoring.read # The authorization scope needed to access GCE metrics
```
The `token` string in the resulting URL is our request token. Once you have a request token, you're ready to [make an API call](#query-the-api).
### Query the API
The [Stackdriver monitoring API](https://cloud.google.com/monitoring/api/ref_v3/rest/) allows you to query all of the performance metrics mentioned in [part one](https://www.datadoghq.com/blog/monitoring-google-compute-engine-performance.md) of this series. The API endpoint for timeseries data follows a regular format, regardless of the timeseries requested: `https://monitoring.googleapis.com/v3/projects/$YOUR_PROJECT_NAME/timeSeries/`.
The recognized parameters are outlined in the table below.
| Parameter | Type | Description ([source][metric-list]) |
| --- | --- | --- |
| filter | string | Restricts the timeseries to be returned. Accepts Boolean operators (AND, OR) to specify metric labels for additional filtering |
| interval.start_time | string (Timestamp format) | The start time for which results should be returned |
| interval.end_time | string (Timestamp format) | The end time for which results should be returned |
| aggregation | object(Aggregation) | Allows aggregation of timeseries over space (ex: average of CPU across all hosts) and time (ex: daily average of CPU use for one machine) |
| pageSize | integer | Maximum number of results to return |
| pageToken | string | Returns additional results. If present, must contain the nextPageToken value returned by a previous call to this method |
| view | enum(TimeSeriesView) | Specifies information to be returned about the timeseries |
The minimum required parameters are `interval.end_time`, `interval.start_time`, and `filter`.
The token should be passed as an [`Authorization` header of type `Bearer`](http://self-issued.info/docs/draft-ietf-oauth-v2-bearer.html#authz-header); with `curl` such a header looks like this:
```text
-H "Authorization: Bearer $TOKEN"
```
*Note*: If you receive a `MissingSecurityHeader` response when calling the API, verify that you are not behind a proxy that is stripping your request headers.
#### Constructing the query
As detailed in the first part of this series, all GCE instance metrics begin with `compute.googleapis.com/` and end with the metric names outlined in the metric tables contained [in that post](https://www.datadoghq.com/blog/monitoring-google-compute-engine-performance.md) (e.g. `instance/cpu/utilization` for CPU utilization).
We can compose a query to return the list of all CPU utilization metrics from any instance, collected between 9:43 pm and 9:45 pm on January 30, 2017:
```text
=> curl -X GET -H "Authorization: Bearer $TOKEN"\
"https://monitoring.googleapis.com/v3/projects/evan-testing/timeSeries/?filter=metric.type+%3D+%22compute.googleapis.com%2Finstance%2Fcpu%2Futilization%22&\
interval.endTime=2017-01-30T21%3A45%3A00.000000Z\
&interval.startTime=2017-01-30T21%3A43%3A00.000000Z"
{
"timeSeries": [
{
"metric": {
"labels": {
"instance_name": "evan-test"
},
"type": "compute.googleapis.com/instance/cpu/utilization"
},
"resource": {
"type": "gce_instance",
"labels": {
"instance_id": "743374153023006726",
"zone": "us-east1-d",
"project_id": "evan-testing"
}
},
"metricKind": "GAUGE",
"valueType": "DOUBLE",
"points": [
{
"interval": {
"startTime": "2017-01-30T21:44:01.763Z",
"endTime": "2017-01-30T21:44:01.763Z"
},
"value": {
"doubleValue": 0.00097060417263416339
}
},
{
"interval": {
"startTime": "2017-01-30T21:43:01.763Z",
"endTime": "2017-01-30T21:43:01.763Z"
},
"value": {
"doubleValue": 0.00085122420706227329
}
}
]
},
...
]
```
As you can see in the output above, without any other parameters, GCE will return a list of all timeseries that satisfy the filter rules. You'll also notice that GCE returns metrics with one-minute granularity.
#### Aggregating timeseries metrics
Using a combination of aggregators and filters, you can flexibly slice and dice the timeseries along any dimension your metrics are labeled with. Using aggregation is a [little more complex](https://cloud.google.com/monitoring/api/ref_v3/rest/v3/projects.timeSeries/list#Aggregation) than a simple, non-aggregated query. Before timeseries can be considered in aggregate, each individual timeseries must be in alignment with all the others, essentially ensuring that all of the aggregated timeseries are of the same type.
Next we'll try using an aggregator in a query, this time asking for the average rate of disk write operations at one-minute intervals across all instances whose name begins with `evan-`, collected between 8:45 pm and 9:00 pm on February 1, 2017:
```text
curl -X GET -H "Authorization: Bearer $TOKEN" \
"https://monitoring.googleapis.com/v3/projects/evan-testing/timeSeries/?\
interval.end_time=2017-02-01T21%3A00%3A00.000000000Z&\
filter=metric.type+%3D+%22compute.googleapis.com%2Finstance%2Fdisk%2Fwrite_ops_count%22+AND+metric.label.instance_name+%3D+starts_with%28%22evan-%22%29&\
interval.start_time=2017-02-01T20%3A45%3A00.000000000Z&\
aggregation.perSeriesAligner=ALIGN_RATE&\
aggregation.alignmentPeriod=60s&\
aggregation.crossSeriesReducer=REDUCE_MEAN"
```
That query yields:
```text
{
"timeSeries": [
{
"metric": {
"type": "compute.googleapis.com/instance/disk/write_ops_count"
},
"resource": {
"type": "gce_instance",
"labels": {
"project_id": "evan-testing"
}
},
"metricKind": "GAUGE",
"valueType": "DOUBLE",
"points": [
{
"interval": {
"startTime": "2017-02-01T21:00:00Z",
"endTime": "2017-02-01T21:00:00Z"
},
"value": {
"doubleValue": 0.42000000000000004
}
},
{
"interval": {
"startTime": "2017-02-01T20:59:00Z",
"endTime": "2017-02-01T20:59:00Z"
},
"value": {
"doubleValue": 0.45333333333333331
}
},
{
"interval": {
"startTime": "2017-02-01T20:58:00Z",
"endTime": "2017-02-01T20:58:00Z"
},
"value": {
"doubleValue": 0.42333333333333334
}
},
[...]
```
*Check out the *[*documentation*](https://cloud.google.com/monitoring/api/ref_v3/rest/v3/projects.timeSeries/list#Aggregation)* for more information on using aggregators.*
You can easily query for the rest of the metrics mentioned in part one by substituting the Google metric name for `instance%2Fdisk%2Fwrite_ops_count` in the example above.
## gcloud
The [`gcloud`](https://cloud.google.com/sdk/gcloud/) command line tool is a versatile part of the [Google Cloud SDK](https://cloud.google.com/sdk/docs/) that allows you to view and manage your Google Cloud Platform resources. It is a veritable Swiss Army knife for GCP and can easily be integrated into existing automation tools (like Ansible or Puppet) for programmatic interaction with GCP resources.
Though you can only access [quota-related metrics](https://www.datadoghq.com/blog/monitoring-google-compute-engine-performance.md#project-metrics) with `gcloud`, it is extraordinarily useful for day-to-day operations tasks, so it is likely to be in your existing toolkit, and we wanted to highlight the metric-retrieval capabilities of this handy tool.
Before you can [take advantage of this powerful tool](#use-gcloud), you first must [install](#install-gcloud) and [configure](#configure-gcloud) it.
### Install gcloud
**Requirements**: Python 2.7 Installing the Google Cloud Platform SDK is straightforward:
1. [Download the appropriate package](https://cloud.google.com/sdk/docs/#install_the_latest_cloud_tools_version_cloudsdk_current_version) for your system/architecture
1. Run the install script to add the tool to your path and enable bash completion: `./google-cloud-sdk/install.sh` on Linux/MacOS
**or** run this one-liner (Linux/MacOS only):
```text
curl https://dl.google.com/dl/cloudsdk/release/install_google_cloud_sdk.bash | bash
```
### Configure gcloud
The SDK supports two authorization methods: user account (via OAuth) and service account. User account authorization is suggested for single users; if you plan to use `gcloud` in a production environment, the service account authorization is suggested.
#### Single user authorization
To authorize a single user, run `glcoud init` (or `gcloud init --console-only` if you're using a headless machine) and follow the prompts. You will be asked to log into your Google Cloud Platform account and provide authorization for the various administrative APIs the tool uses. If you have multiple projects in GCP, you will be asked which project you'd like to use, as well as the default GCE zone you use. Of course, these values are just defaults; you can add configurations for other projects and zones if need be (see `gcloud topic configurations` for more info).
#### Service account authorization
The service account authorization flow is as follows:
1. Navigate to the [Service Accounts](https://console.cloud.google.com/permissions/serviceaccounts) page in GCP
1. Create a service account or choose an existing account
1. Open the hamburger menu (three stacked dots), select **Create Key** and download the JSON-formatted key file to a location accessible by your Cloud SDK tools
1. Run `gcloud auth activate-service-account --key-file [KEY_FILE]`
1. Delete the key file, as it is no longer needed
Regardless of the authorization method you choose, you can verify your configuration settings with `gcloud config list`.
### Use gcloud
Once gcloud is configured, you can retrieve all of the [quota metrics](https://www.datadoghq.com/blog/monitoring-google-compute-engine-performance.md#project-metrics) from part one of this series with a simple one-liner:
```text
gcloud compute project-info describe
```
Because most of the capabilities of gcloud go beyond the scope of this series, you can check out a full list of `gcloud` commands [here](https://cloud.google.com/sdk/gcloud/reference/).
## Stackdriver
Google's Stackdriver monitoring service offers a simple interface for surfacing and alerting on the GCE metrics mentioned in part one. Using Stackdriver *does* require you to make a [Stackdriver account](https://cloud.google.com/migrate/compute-engine/docs/4.8/how-to/monitoring/using-stackdriver-monitoring), which is separate from your GCP account.
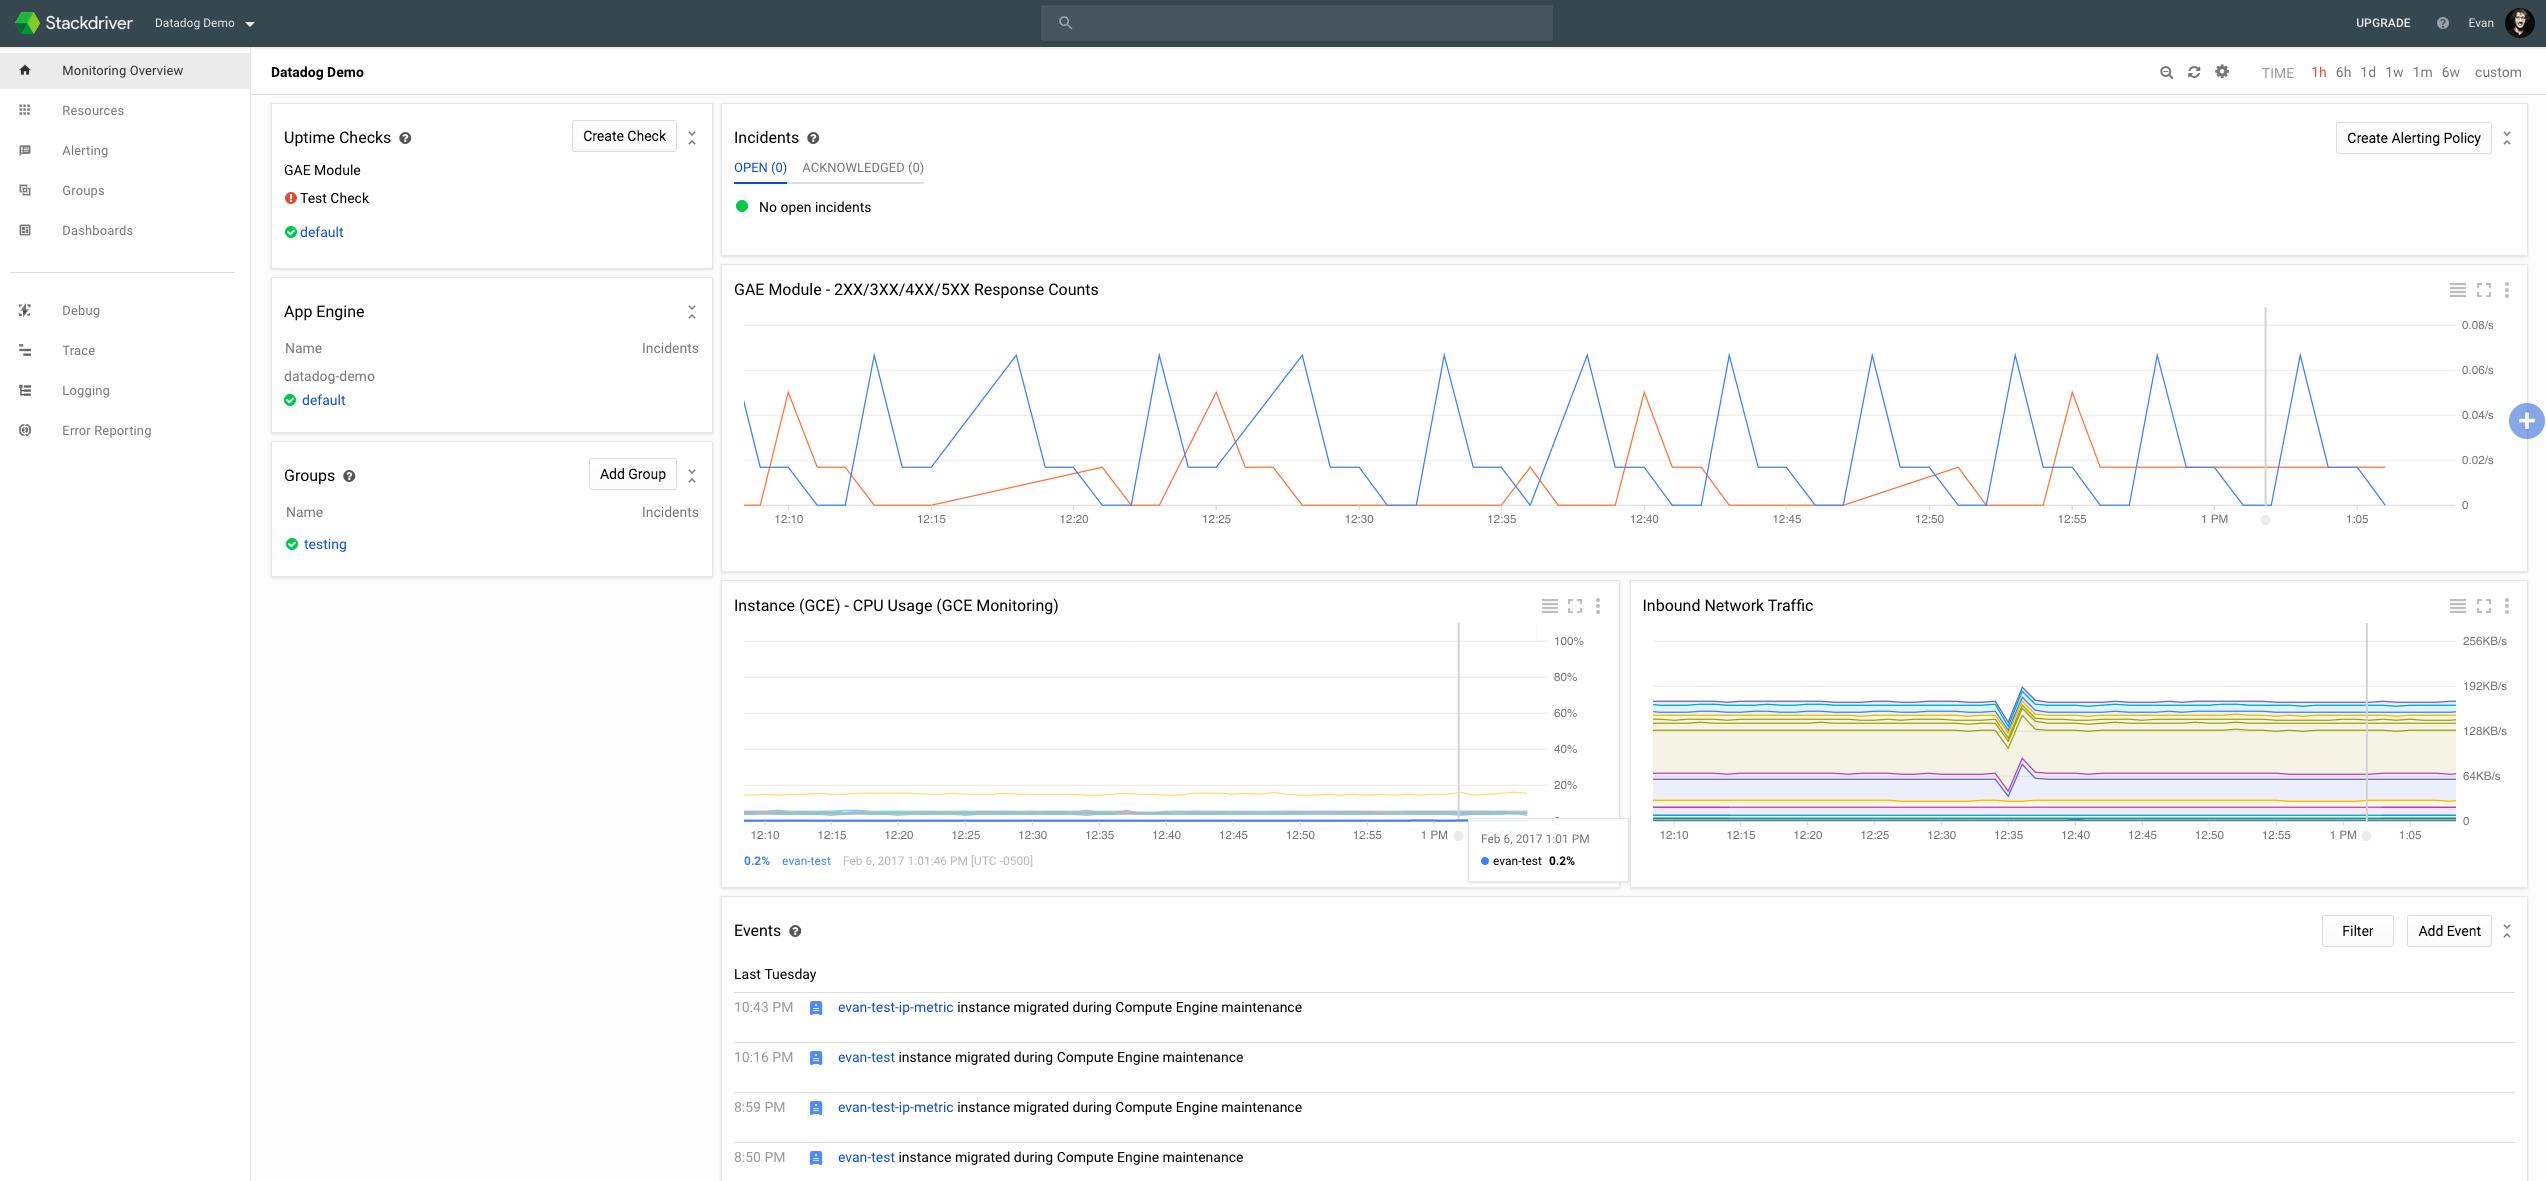
After creating an account, you will have access to a customizable overview dashboard like the one above. From this interface you can [set alerts](#stackdriver-alerting) and [create dashboards](#stackdriver-dashboards).
### Stackdriver dashboards
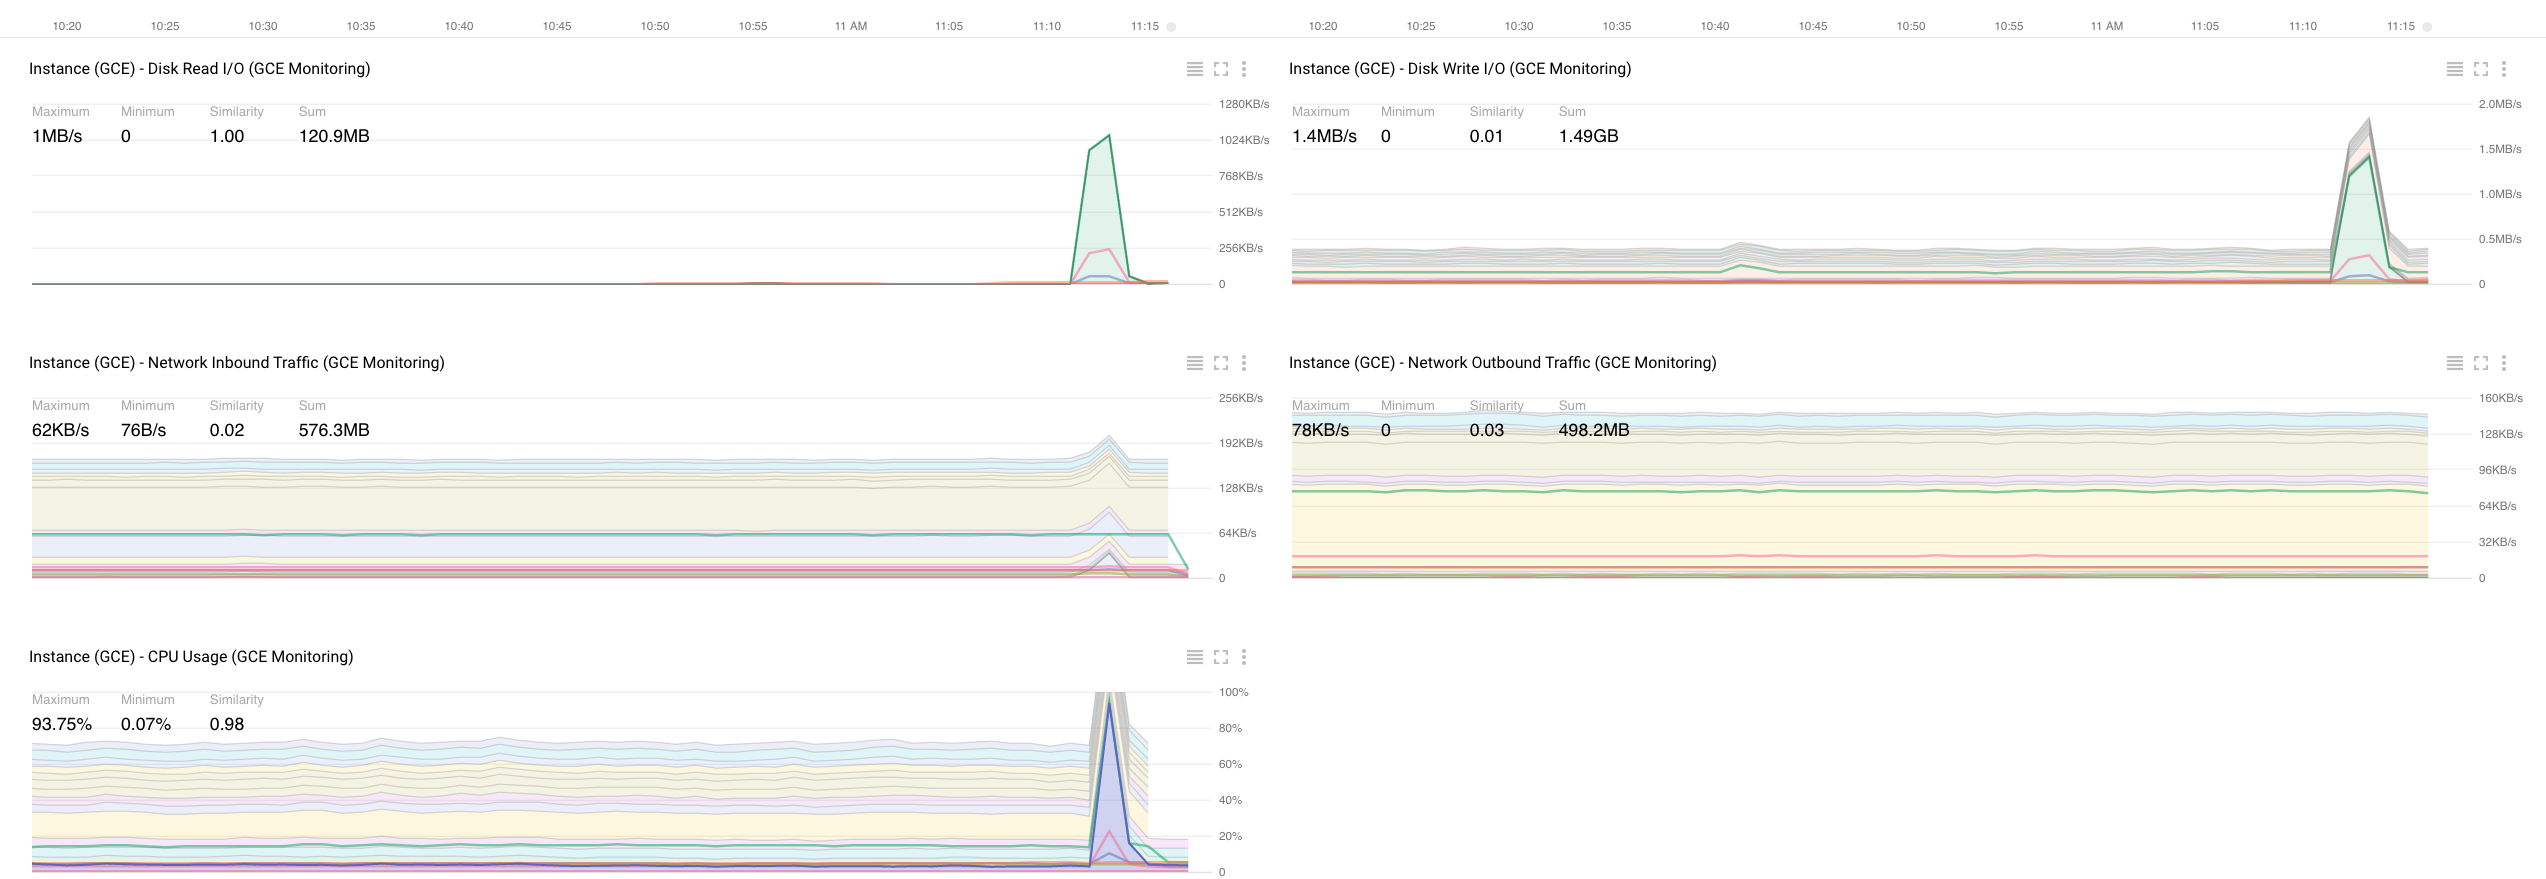
Stackdriver dashboards allow you to visualize the instance-level metrics from part one of this series, though it does not report firewall or quota metrics. For GCE, you can add charts for CPU usage, disk read/write I/O and network traffic, as you can see in the dashboard below:
### Stackdriver alerting
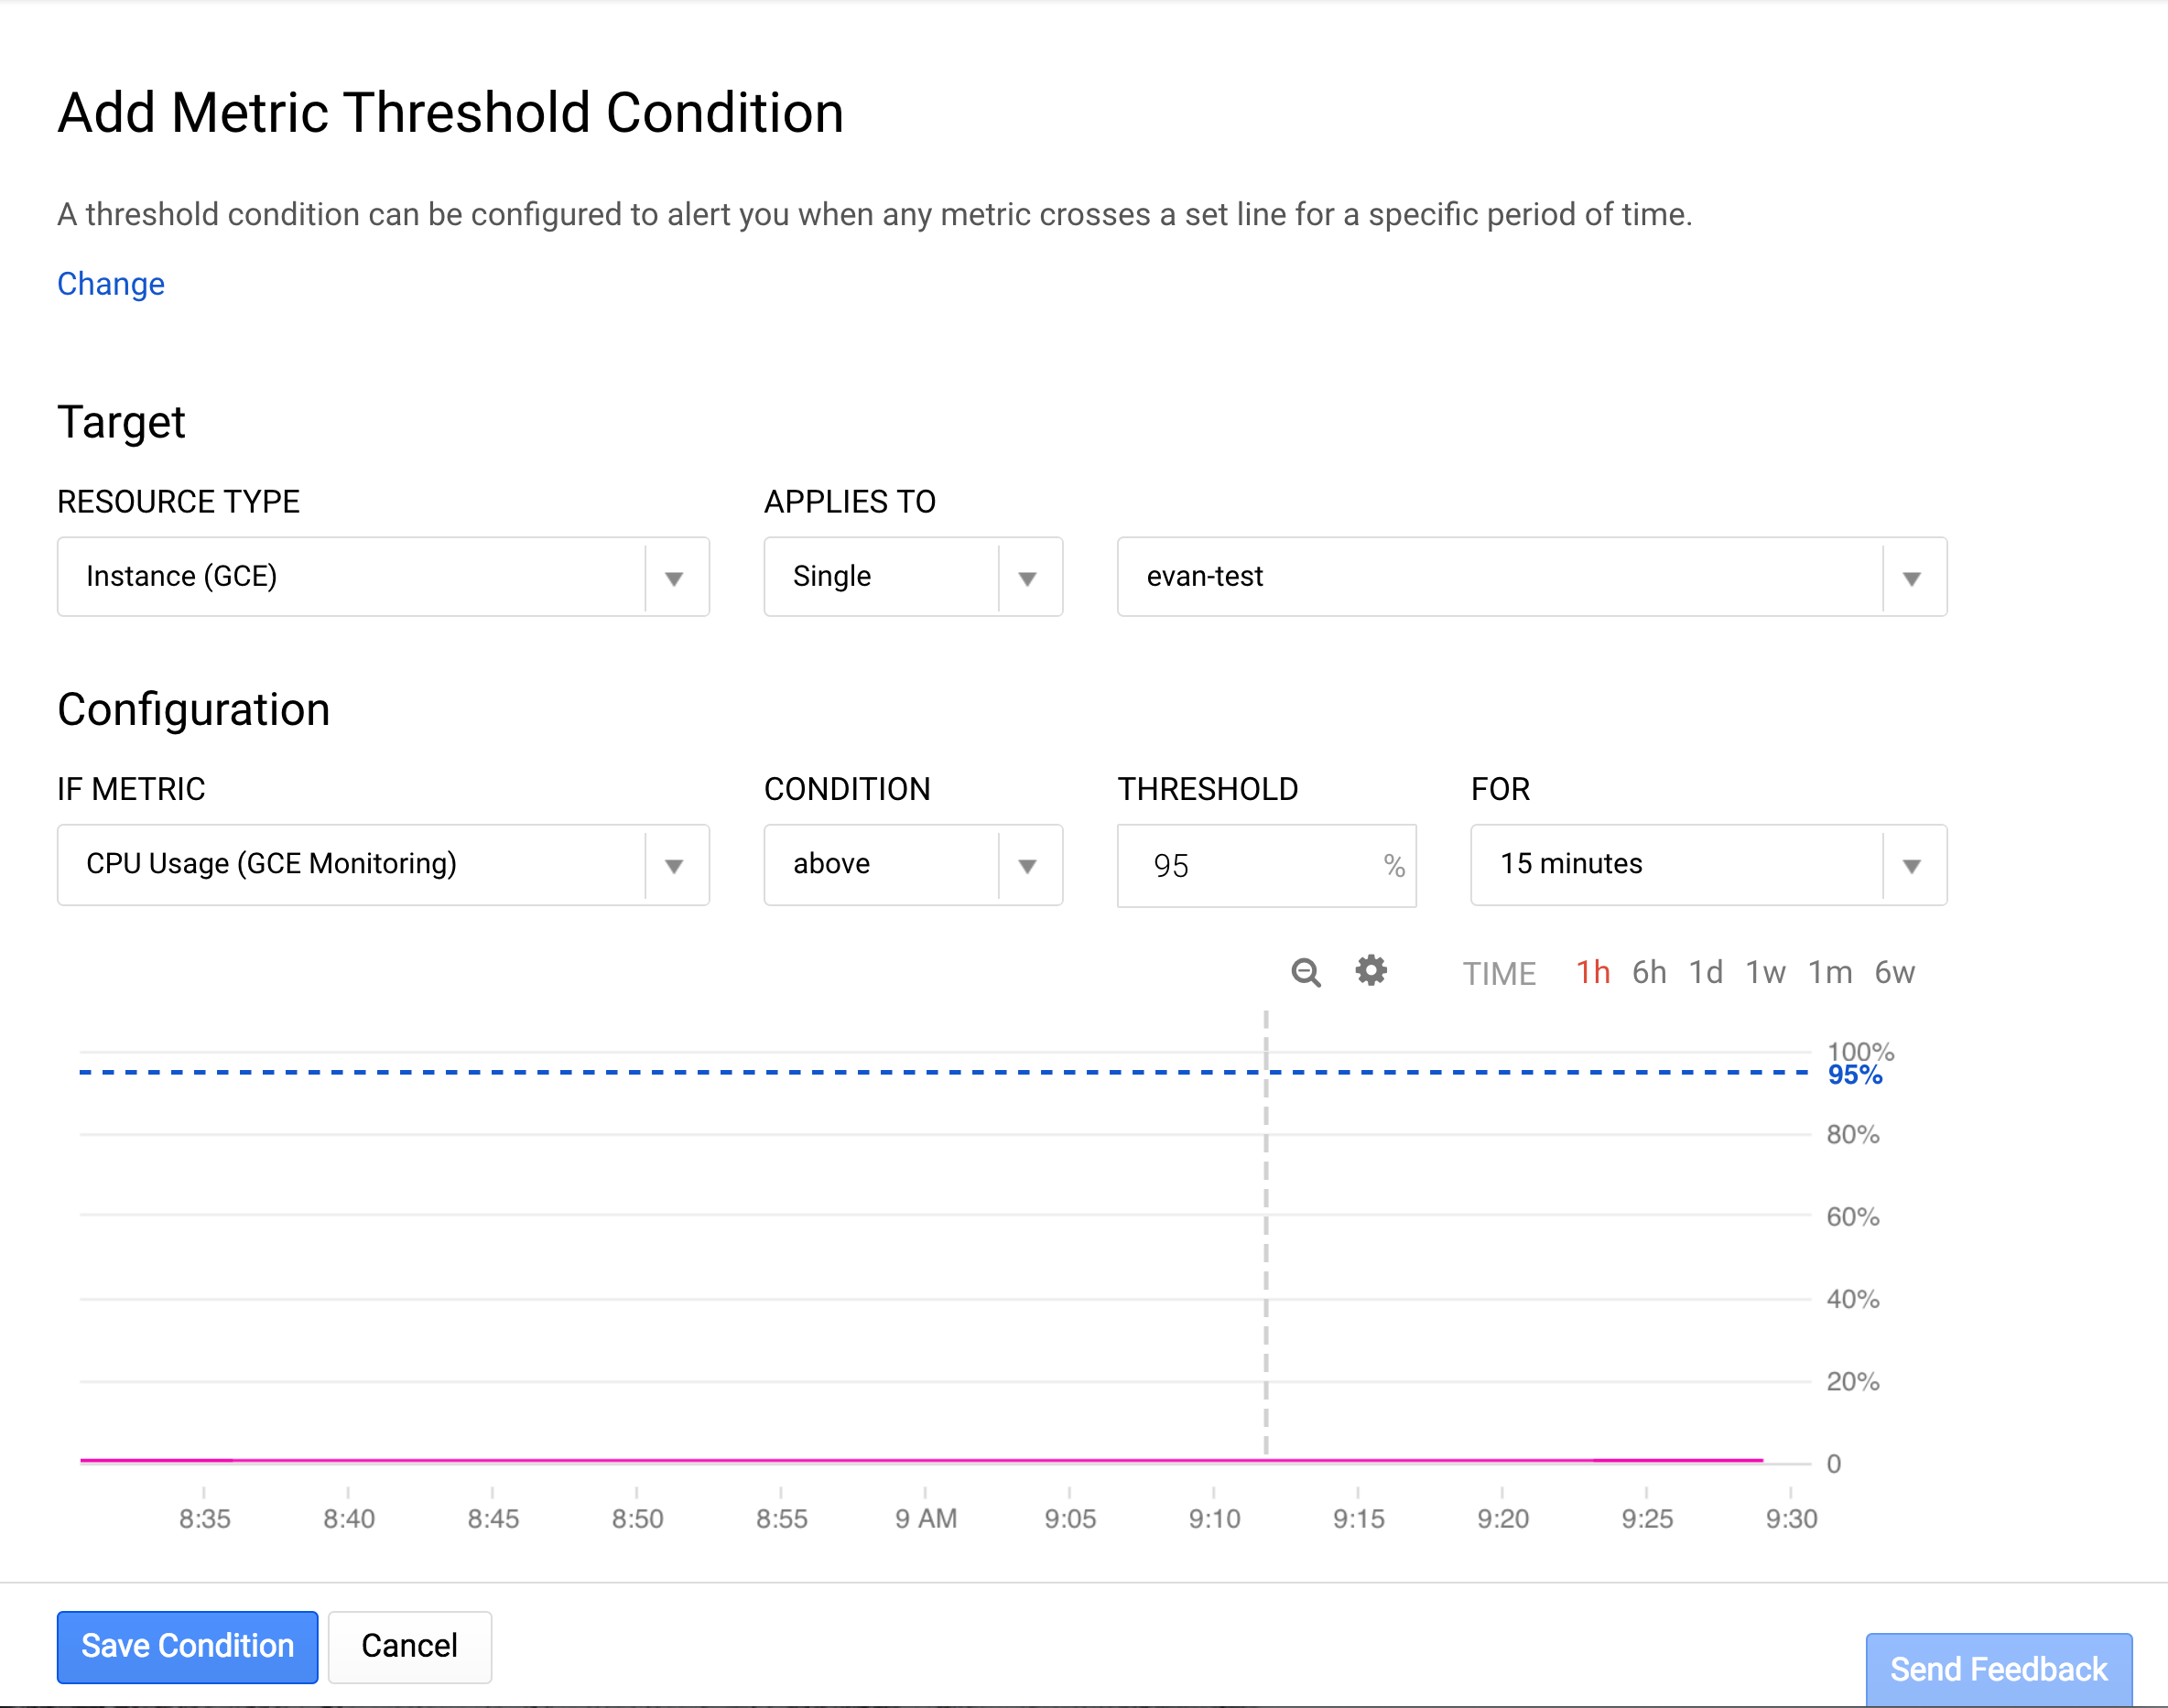
Stackdriver also provides a built-in alerting system, so you can configure alerts on the GCE metrics mentioned above. The free service tier allows you to set up basic email alerts on GCP metrics that cross static thresholds or that are missing data.
Here's an example alert for extended periods of prolonged CPU usage:
## From collection to action
In this post we’ve covered three general ways to surface metrics from Google Compute Engine using simple, lightweight tools already available on your system.
For production systems, you will likely want a monitoring platform that readily ingests GCE performance metrics, and also allows you to closely monitor the performance of your infrastructure and applications, even in other environments. And to analyze trends or robustly detect anomalies, you'll need a platform that retains and analyzes historical data as well as real-time metrics.
At Datadog, we’ve developed integrations with over 1,000 technologies, including GCE and most Google Cloud Platform technologies, to make your infrastructure and applications as observable as possible.
For more details, check out our guide on [monitoring GCE with Datadog](https://www.datadoghq.com/blog/monitor-google-compute-engine-with-datadog.md), or get started right away with .