---
title: "How Kubernetes DRA can improve GPU utilization and cut costs"
description: "Learn how Kubernetes Dynamic Resource Allocation raises GPU utilization, and what to watch to confirm it’s actually reducing your GPU costs."
author: "Kathy Lin, David Lentz"
date: 2026-10-15
tags: ["gpu monitoring", "cloud cost management", "kubernetes", "containers", "ai", "finops"]
blog_type_id: the-monitor
locale: en
---
[Organizations are spending more on GPUs](https://www.datadoghq.com/state-of-cloud-costs/#1) as they move AI workloads into production, and improving GPU utilization is a key priority. But Kubernetes's legacy[ device plugin model](https://kubernetes.io/docs/concepts/extend-kubernetes/compute-storage-net/device-plugins/) can limit those improvements because it constrains how workloads request and consume GPU resources. Teams must configure GPU partitioning before workloads are scheduled. Resource requests cannot distinguish GPUs by capability, and a workload can reserve an entire GPU while using only part of its capacity. These constraints can leave paid capacity idle or make jobs run longer.
[Kubernetes Dynamic Resource Allocation (DRA)](https://kubernetes.io/docs/concepts/scheduling-eviction/dynamic-resource-allocation/) provides a more flexible alternative to the device plugin model—one that can consolidate workloads onto fewer GPUs, shorten topology-sensitive job runtimes, and lower infrastructure spend. DRA lets Kubernetes dynamically select and allocate GPUs—as well as FPGAs, SmartNICs, and other specialized hardware—based on each workload’s requirements. DRA can distinguish among devices to enable precise, topology-aware scheduling and allows multiple workloads to use the same GPU, enabling increased utilization.
This post looks at how DRA can help you improve GPU utilization compared to the legacy device plugin model, and how Datadog can help you track those improvements and the resulting cost savings. We'll show you:
- [How the legacy device plugin model limits GPU utilization](#how-kubernetes-device-plugin-model-limits-gpu-utilization)
- [The three mechanisms DRA uses to raise utilization](#how-dra-can-improve-gpu-utilization)
- [How to confirm DRA's utilization and cost gains](#how-to-confirm-dras-utilization-and-cost-gains)
- [How Datadog GPU Monitoring can help you connect utilization changes to infrastructure cost](#how-datadog-can-help-you-realize-dras-cost-savings)
## **How Kubernetes' device plugin model limits GPU utilization**
Before looking at what DRA changes, it helps to understand how the device plugin model limits GPU utilization. This section uses NVIDIA-specific terms because NVIDIA is a dominant accelerator vendor with mature DRA support for GPUs. The underlying mechanics, though, apply to any vendor whose device plugin supports[ Kubernetes's extended resource model](https://kubernetes.io/docs/concepts/configuration/manage-resources-containers/#extended-resources), which lets nodes and pods advertise and request resources other than CPU and memory.
### **Fixed partition profiles can lead to poor fit**
[NVIDIA's Multi-Instance GPU (MIG)](https://www.nvidia.com/en-us/technologies/multi-instance-gpu/) feature safely isolates multiple workloads on a single GPU by partitioning it into separate hardware instances with dedicated compute, memory, and cache resources. But an administrator must configure the GPU's geometry—NVIDIA's term for the specific combination of MIG instance profiles configured on it—before workloads are scheduled. After that, the geometry doesn't automatically adapt to demand, and that rigidity can lead to two types of cost inefficiency.
**Oversized partitions leave capacity idle.** An administrator must guess at the compute resources that a new workload will need. If a partition is sized larger than what the workload actually uses, the unused portion sits idle for as long as the workload runs. The underlying GPU host keeps incurring cost regardless. Because a GPU's partitions can't be resized while workloads are using the GPU, correcting an oversized geometry requires draining and reconfiguring the node. That administrative overhead can delay the fix, prolonging the cost inefficiency.
**Undersized or mismatched partitions leave workloads unable to run.** Say a node is partitioned into four `1g.10gb` instances. A pod requesting a single instance (`nvidia.com/mig-1g.10gb: 1`) schedules onto one of the partitions successfully. But if a second pod needs a larger `3g.40gb` profile, the node's geometry can't accommodate it. Even though the node has enough total GPU capacity to run it, the larger pod remains `Pending` because that capacity isn't exposed in a profile the pod can use.
A pending pod still needs GPU capacity somewhere, and that can force teams to pay for additional capacity to run workloads that their existing fleet could otherwise absorb.
### **Opaque GPU counts don't reflect workload needs**
The device plugin model represents GPUs (or MIG partitions, if applicable) as simply a quantity of interchangeable units. The model can't convey a device's memory capacity, model, architecture, or topology. That opacity keeps workloads from expressing specific requirements, creating two distinct problems: a poor match between a workload and the device it lands on, and an inability to guarantee placement for workloads that need specific GPU topology.
**Counts alone can produce a poor device match.** A training job that needs enough GPU memory to hold a large batch could land on an older, lower-memory model, since the request specifies only a count, not a memory or architecture minimum. A mismatch like that can force smaller batches or cause out-of-memory errors that extend the job's runtime and cost.
**Undifferentiated counts can't express topology requirements.** Distributed AI training requires communication between all GPUs at every step. Keeping a workload's GPUs within the same NVLink domain avoids the added delay of communicating across domains. Within a domain, the [NVLink](https://www.nvidia.com/en-us/products/workstations/nvlink-bridges/) interconnect—often extended across more GPUs by an [NVSwitch](https://www.nvidia.com/en-us/data-center/nvlink/)—supplies the bandwidth that keeps communication fast. But the count conveys no topology information, so a workload's resource request can't specify that its GPUs share an NVLink domain, and Kubernetes can't guarantee that placement. A topology that spans more than one NVLink domain can slow the job, reduce utilization, and contribute to wasteful cloud spend.
### **The scheduler can't account for unused capacity**
Some devices support hardware-level resource sharing, letting multiple workloads run on one GPU and fill the idle capacity between any single workload's peaks. Realizing that safely, though, requires scheduler-managed capacity accounting: tracking how much of the shared device each workload is using so the total never exceeds what's available. The device plugin model provides no such accounting.
Without that accounting, the device plugin model treats every allocation as exclusive. Once it allocates a GPU or MIG partition, that resource remains reserved for the container that requested it, whether or not the workload fully uses it. A workload may request a whole GPU (or a MIG partition) sized for its peaks; between peaks, reserved compute sits idle, unavailable to other workloads while the container holds the allocation.
The NVIDIA device plugin does expose some of that underlying hardware sharing, through[ time-slicing](https://docs.nvidia.com/datacenter/cloud-native/gpu-operator/latest/gpu-sharing.html) and Multi-Process Service (MPS), but neither adds the capacity accounting that the scheduler needs. With time-slicing, an operator configures the plugin to advertise more GPU replicas than physically exist. A replica count sets the oversubscription level, but it doesn't declare each workload's actual capacity, so the plugin can't lend or reclaim idle capacity between workloads. MPS instead lets multiple processes use a GPU concurrently, with its sharing policy also set through device-plugin configuration rather than the workload's extended-resource request. Neither mode provides hardware isolation equivalent to MIG.
| Column 1 | Column 2 | Column 3 |
| --- | --- | --- |
| MIG | Yes: Each instance has dedicated compute, memory, and cache. | No: Geometry is fixed, not usage-based. |
| Time-slicing | No: Replicas share the GPU without isolation. | No: Replica count sets oversubscription, not per-workload capacity. |
| MPS | No: Concurrent processes are shared. | No: Sharing policy is set at device-plugin config, not per-request. |
The direct cost risk is underutilization. You pay to run a host while its allocated GPUs or MIG instances remain only partly active. You can detect this waste with NVIDIA Management Library (NVML) and Data Center GPU Manager (DCGM) utilization metrics, which can show devices running at low average activity.
But that visibility doesn't help you act on the waste. The device plugin model has no mechanism for a workload to declare a specific share of a device's capacity. Nor does it let the scheduler reclaim what goes unused. NVML and DCGM can show you that a GPU is idle, but knowing that doesn't give Kubernetes a way to reassign the unused capacity.
## **How DRA can improve GPU utilization**
DRA replaces the device plugin with a **driver, **which is a software component provided by the device's hardware vendor (for example, NVIDIA, in the case of GPUs). The driver discovers a node's devices, publishes them to Kubernetes, and enforces the allocations that the scheduler assigns. Whereas the device plugin model advertises only opaque resource counts, a driver publishes structured device details that let workloads request devices and capacity more precisely.
Two key Kubernetes objects represent the driver's publish side and the workload's request side:
- A [**ResourceSlice **](https://kubernetes.io/docs/reference/kubernetes-api/resource/resource-slice-v1/)defines the attributes and capacity of available devices across a specific node, selected nodes, or the whole cluster. A DRA driver automatically writes these slices directly to the API, eliminating the need for operators to author them manually.
- A[ **ResourceClaim **](https://kubernetes.io/docs/reference/kubernetes-api/resource/resource-claim-v1/)declares the specific device requirements of a workload. Similar to a[ PersistentVolumeClaim](https://kubernetes.io/docs/reference/kubernetes-api/core/persistent-volume-claim-v1/), it allows the cluster to dynamically bind a matching resource to that workload at runtime.
This section explains how DRA matches ResourceClaims with ResourceSlices by using dynamic partition profiles; structured, topology-aware allocation; and scheduler-managed capacity accounting.
### **Dynamic partition profiles improve workload fit**
A **pool** groups the ResourceSlices that describe one node's (or node group's) available devices and capacity. A ResourceSlice is associated with a pool via its `pool.name` value. For partitionable hardware, the ResourceSlices in a pool can list more than one allocation option for the same physical capacity. A driver can also split a large pool across multiple ResourceSlices.
Within a ResourceSlice, named **CounterSets** define **shared counters** that track the remaining capacity of a resource, such as GPU memory. A **logical device** is an entry in a ResourceSlice's device list. It can describe a fraction of a physical device, an entire physical device, or a combination of several physical devices.
When the scheduler allocates a logical device, it debits the shared counters that the device consumes and rejects any device whose declared consumption would exceed what those counters have left. In the following example, the driver publishes two ResourceSlices in the pool named gpu-pool. The first resource slice (named gpu-counters) defines an 8 GiB memory counter and the second ResourceSlice (named gpu-devices) lists two logical devices, each declared to require 6 GiB from that counter:
```
apiVersion: resource.k8s.io/v1
kind: ResourceSlice
metadata:
name: gpu-counters
spec:
nodeName: worker-1
pool:
name: gpu-pool
generation: 1
resourceSliceCount: 2
driver: gpu.example.com
sharedCounters:
- name: gpu-1-counters
counters:
memory:
value: 8Gi
---
apiVersion: resource.k8s.io/v1
kind: ResourceSlice
metadata:
name: gpu-devices
spec:
nodeName: worker-1
pool:
name: gpu-pool
generation: 1
resourceSliceCount: 2
driver: gpu.example.com
devices:
- name: logical-device-1
consumesCounters:
- counterSet: gpu-1-counters
counters:
memory:
value: 6Gi
- name: logical-device-2
consumesCounters:
- counterSet: gpu-1-counters
counters:
memory:
value: 6Gi
```
Because each logical device consumes 6 GiB from the same 8 GiB counter, the scheduler can allocate only one device at a time.
The two logical devices in the preceding example illustrate[ **partitionable devices**](https://kubernetes.io/docs/concepts/resource-management/dynamic-resource-allocation/dra-features/#partitionable-devices), the DRA mechanism (beta as of Kubernetes v1.36) that resolves the fixed-partition-profile problem described earlier. Instead of locking a physical device into one preconfigured geometry, partitionable devices lets the scheduler choose among the alternative logical devices a ResourceSlice lists, fitting each claim to the capacity actually available. This improved fit lets teams consolidate workloads and release GPU capacity, directly reducing infrastructure costs. Before selecting a partition, the scheduler checks that the shared counters it draws from have enough remaining capacity to satisfy the ResourceClaim.
### **Structured allocation enables topology-aware scheduling**
A **DeviceClass** is a cluster-scoped object created by an administrator. Like a[ StorageClass](https://kubernetes.io/docs/concepts/storage/storage-classes/), it lets selection criteria be defined once so that a ResourceClaim can reference those criteria by name (`deviceClassName`) instead of repeating them in every claim. Combined with[ Common Expression Language (CEL)-based selectors](https://kubernetes.io/docs/reference/using-api/cel/) and constraints such as `matchAttribute` and `distinctAttribute`, a DeviceClass lets the scheduler match a claim's requirements against a ResourceSlice's device attributes and capacity. Some drivers expose the GPU's compatibility and capacity, letting claims request a particular GPU generation, product, architecture, or capacity instead of only a GPU count.
A ResourceSlice can identify which GPUs share a high-bandwidth connection, such as an NVLink domain, by publishing a topology attribute on each device entry. A ResourceClaim can then use `matchAttribute` to require that every GPU it allocates report the same topology attribute, guaranteeing they all sit in the same domain.
When the scheduler schedules the workload, it writes the allocation result to the ResourceClaim's status, binding the claim to a specific device. You can inspect that bound ResourceClaim directly by using:
`kubectl get resourceclaim -n -o yaml`
The output shows you the DeviceClass, driver, pool, selected device, and the node selector that constrains where the pod can run:
```
apiVersion: resource.k8s.io/v1
kind: ResourceClaim
metadata:
name: gpu-training-claim
namespace: ml-team
spec:
devices:
requests:
- name: gpu-request
deviceClassName: nvidia-gpu # the DeviceClass this request was matched against
status:
allocation:
devices:
results:
- request: gpu-request # ties this result back to the named request above
driver: gpu.nvidia.com # which DRA driver fulfilled the request
pool: node-a-gpu-pool # which ResourceSlice pool the device came from
device: gpu-0 # the specific device selected within that pool
nodeSelector:
nodeSelectorTerms:
- matchFields:
- key: metadata.name
operator: In
values:
- node-a # the node this claim is now bound to
```
This confirms the claim bound to `node-a` via `gpu-0`, as the concrete result of the DeviceClass and topology matching described above.
### **Consumable capacity allocates GPUs across multiple claims**
DRA closes the capacity-accounting gap described earlier by enabling drivers to publish each device’s actual attributes and capacity. The scheduler can then allocate that capacity across multiple claims.
[**Consumable capacity**](https://kubernetes.io/docs/concepts/resource-management/dynamic-resource-allocation/dra-features/#consumable-capacity), a Kubernetes feature in beta since v1.36, lets multiple claims consume portions of a device’s advertised capacity without exceeding the total available. A driver enables these allocations by setting `allowMultipleAllocations`. For example, if a driver advertises 80 GiB of shareable GPU memory, two claims requesting 20 GiB each consume 40 GiB, leaving the remaining 40 GiB available for other workloads.
Consumable capacity differs from the shared-counter accounting used in dynamic partition profiles. Dynamic partition profiles let the scheduler select from predefined logical-device shapes. Consumable capacity lets claims request arbitrary amounts directly from a device’s advertised capacity, without predefined shapes. A driver can use both mechanisms together: Dynamic partition profiles address fixed partition geometry, while consumable capacity provides scheduler-managed accounting for shared capacity.
This approach also differs from time-slicing, which advertises a node-wide number of identical replicas but does not record how much capacity an individual workload needs.
### **What DRA doesn't do**
DRA closes real gaps in the device plugin model, but it isn't a complete solution. The following limitations can affect how you configure DRA and how much utilization or cost improvement you should expect:
- MIG creation through DRA requires the driver's alpha `DynamicMIG` feature, which is disabled by default.
- Active claims can still consume shared counters in a combination that leaves no compatible partition for a new request, even when some capacity remains.
- A topology guarantee from `matchAttribute` holds only within a single ResourceClaim's own allocation. Multi-node jobs, where each pod holds its own claim, need driver-specific support (such as NVIDIA ComputeDomain) to coordinate GPUs across pods into the same NVLink domain.
- Consumable capacity prevents declared allocations from exceeding advertised capacity, but it doesn't enforce compute or memory boundaries at runtime. Enforcement and isolation depend on the DRA driver and its sharing mode.
- DRA doesn't assign priority to claims under any of these mechanisms. A ResourceClaim has no priority field, and Kubernetes won't preempt an allocated device for a higher-priority claim. If a lower-priority job holds the device a critical job needs, the critical job stays `Pending` until that device is released.
## **How to confirm DRA's utilization and cost gains**
The previously described ResourceClaim and ResourceSlice signals show which device the scheduler assigned to a claim and how much capacity a pool has left. These signals don't surface utilization and can't help you ensure the utilization gains DRA promises. Confirming that gain, along with whether jobs finish sooner or capacity can be released, means combining allocation data with workload, GPU, and cost signals. This section walks through three questions that are worth answering before crediting DRA with the utilization and cost improvements it enables.
### **Can the existing GPU fleet absorb more work?**
To see whether the existing GPU fleet can absorb more work as demand grows, watch completed work volume and time spent `Pending` at a stable fleet size. Scheduling activity and `Pending` duration are indirect signals that reflect workload behavior rather than the fleet's allocation state directly. If completed work increases without added `Pending` time, the fleet is absorbing more demand. If `Pending` time increases instead, you can find out why by using this command:
`kubectl get events -A --field-selector reason=FailedScheduling`
The event message surfaces the blocking selector, requested capacity, taint, topology requirement, or node-accessibility issue affecting the pod's placement. Both signals confirm whether the fleet is absorbing more work, but neither tells you how much spare capacity remains.
```
NAMESPACE LAST SEEN TYPE REASON OBJECT MESSAGE
default 2m Warning FailedScheduling pod/gpu-training-job-7x2kq 0/1 nodes are available: 1 Insufficient nvidia.com/gpu. preemption: 0/1 nodes are available: 1 Preemption is not helpful for scheduling.
```
An event's `reason` field gives you an indirect capacity signal tied to one failed placement, but it only surfaces after a pod has already failed to schedule. Using a ResourcePoolStatusRequest instead gives you a direct, pool-wide allocation signal that you can check proactively, before a shortage causes a failure. ResourcePoolStatusRequest reports point-in-time `totalDevices`, `allocatedDevices`, `availableDevices`, and `unavailableDevices` counts for a specific pool. You can create YAML to define a ResourcePoolStatusRequest, naming the driver and pool that you want to check:
```
apiVersion: resource.k8s.io/v1alpha3
kind: ResourcePoolStatusRequest
metadata:
name: gpu-pool-status
spec:
driver: gpu.example.com
poolName: gpu-pool
```
Create the object by using the command `kubectl apply`.
Then read the result back by using:
`kubectl get resourcepoolstatusrequest gpu-pool-status -o yaml`
```
spec:
driver: gpu.example.com
poolName: gpu-pool
status:
poolCount: 1
pools:
- driver: gpu.example.com
poolName: gpu-pool
nodeName: worker-1
totalDevices: 8
allocatedDevices: 6
availableDevices: 2
unavailableDevices: 0
conditions:
- type: Complete
status: "True"
```
Because this is a point-in-time snapshot, not a live view, recreate the object whenever you want an updated reading.
The `status.pools` values in a ResourcePoolStatusRequest tell you how many devices are allocated versus available at that moment. `status.pools` provide an allocation-state signal, not a utilization measurement, and the count of availableDevices doesn't necessarily indicate capacity that satisfies a claim's requirements. Cross-check these counts against ResourceClaim status and the relevant ResourceSlices before concluding the fleet has room to spare. (ResourcePoolStatusRequest is an alpha feature, disabled by default, since Kubernetes v1.36.)
### **Do topology-sensitive jobs finish sooner?**
To see whether topology-sensitive jobs finish sooner, compare job duration, throughput, and GPU activity for comparable workloads before and after you enforce topology constraints with the `matchAttribute` selectors described earlier. For distributed training jobs, also compare per-step time, since a placement that spans nodes adds communication latency at every step.
Keep in mind that a placement satisfying a topology constraint isn't guaranteed to be the best placement available. The scheduler uses a first-fit strategy rather than selecting a globally optimal device set, so enforcing topology doesn't by itself guarantee the fastest possible job. Measure directly rather than assuming enforcement alone improves throughput.
To know which specific GPUs to check for topology and performance data, confirm which devices actually satisfied the claim by checking `ResourceClaim.status.allocation` and the referenced ResourceSlices for the topology attribute value each device reported. For example, in the `status.allocation.devices.results` block shown previously, the `pool` and `device` fields name which ResourceSlice and device DRA selected. Look up that device's entry in the corresponding ResourceSlice to confirm the topology attribute it reported, such as a shared `nvlinkDomain` value across every device in the claim.
If job performance doesn't improve as expected, check for a failing device: GPU temperature, throttling, error-correcting code (ECC) memory errors, and[ Xid errors](https://docs.nvidia.com/deploy/xid-errors/latest/introduction.html). (The DRA driver's implementation determines whether these signals appear in Kubernetes resource status.) You can act on a failing device directly by using[ device taints and tolerations](https://kubernetes.io/docs/concepts/resource-management/dynamic-resource-allocation/device-taints/) (stable as of v1.37), which mark it unschedulable without draining the whole node.
### **Can you release GPU capacity?**
A sustained utilization gain lowers spend only when one of two things happens: the organization releases freed capacity, or billed GPU-hours decline on their own as demand tapers. Don't credit DRA with cost savings until you see one of those two signals move. Monitor ResourcePoolStatusRequests to track total, allocated, and available devices. You can also track GPU-hours, idle time, node count, and infrastructure cost through the observability signals described in the next section.
To see how much of a shared device a claim is actually using, compare its `consumedCapacity` against the device's declared total and a compatible usage-telemetry signal, using matching units and verified workload attribution. For example, if a claim's `consumedCapacity` is 20 GiB against an 80 GiB pool, and GPU-memory usage telemetry for that workload shows roughly 20 GiB in use, the claim's declared share matches its actual demand. If usage telemetry instead shows only 5 GiB in use against that same 20 GiB claim, the workload is holding more declared capacity than it needs.
Low GPU activity alone does not prove that claim is oversized, though: Input bottlenecks, synchronization, initialization, checkpointing, and deliberate headroom can produce the same signal. Rule these out and confirm that low usage persists across multiple checks before releasing the claim's capacity.
The point of confirming this gain is to release capacity, but it carries risk. Before releasing capacity held by a ResourceClaim, confirm its ownership, expected life cycle, and current consumers. A directly referenced claim may intentionally persist and can serve multiple consumers. If you plan to release capacity by scaling down nodes, check Cluster Autoscaler's DRA support first. Confirm that your cluster is built on Kubernetes 1.36 or later, because that's the version that added Cluster Autoscaler's awareness of partitionable devices.
Cluster Autoscaler must track active ResourceClaims correctly before scaling down a node, because an autoscaler that is unaware of DRA can otherwise remove a node that is still serving allocated devices. Support still depends on the DRA driver and node-group model. Autoscaled node groups must expose predictable, node-local devices, and support for larger multi-node device topologies remains limited. Verify the autoscaler and driver documentation before assuming a DRA claim can scale from zero or consolidate safely.
## **How Datadog can help you realize DRA's cost savings**
Kubernetes is the source of the allocation data described earlier in this post, including FailedScheduling events, ResourcePoolStatusRequest, and ResourceClaim status. But Kubernetes doesn't expose workload and GPU metrics to confirm that a topology-sensitive job finishes sooner, or the cost telemetry data that can show whether you can safely release capacity. Datadog GPU Monitoring supplies that full-stack visibility across your workloads, hardware and infrastructure cost.
### **GPU Monitoring: Device-level utilization**
[Datadog GPU Monitoring](https://docs.datadoghq.com/gpu_monitoring.md) surfaces per-device and per-host GPU utilization. The `gpu.gr_engine_active` metric can help you identify idle devices, and `gpu.sm_active` can help you detect inefficient ones. Whenever you adjust partitioning, placement, or shared-capacity requests—whether that's your first DRA rollout or a later tuning pass—you can compare your baseline alongside the post change data in the Summary Graph section of the GPU Monitoring Explorer page. This enables you to have a shared, dynamic source of truth that your team can use to confirm the gain.
Compare device utilization with workload throughput and with a compatible `consumedCapacity` quantity from the ResourceClaim. For example, compare allocated GPU memory with observed memory use, not with GPU-activity percentage. [GPU Monitoring's Explorer page](https://app.datadoghq.com/gpu-monitoring?gpu_provisioning__end=1791392272000&gpu_provisioning__fromUser=true&gpu_provisioning__paused=false&gpu_provisioning__refresh_mode=sliding&gpu_provisioning__start=1791391372000&graph=gpu.sm_active%2Cgpu.sm_occupancy%2Cgpu_memory_utilization&mColumns=id%2Cgpu_idle_cost%2Cgpu_idle_hours%2Csystem.cpu.user%2Chost_memory_utilization%2Cgpu.sm_active%2Cgpu.sm_occupancy%2Cgpu_memory_utilization%2Cgpu.pci.throughput.rx%2Cgpu.pci.throughput.tx%2Cgpu.nvlink.throughput.raw.rx%2Cgpu.nvlink.throughput.raw.tx&mConfigure=false&mEnd=1791392272000&mGpuResource=kube_cluster_name&mGroupBy=host&mPage=fleet&mRETab=pods&mShowK8s=true&mStart=1791388672000&mView=nvidia&mWorkloadNav=host&page=0&refresh_mode=sliding&sort=gpu.sm_active&workflow=performance&paused=false) also surfaces the thermal or power cap throttling and critical ECC/XID errors described previously.
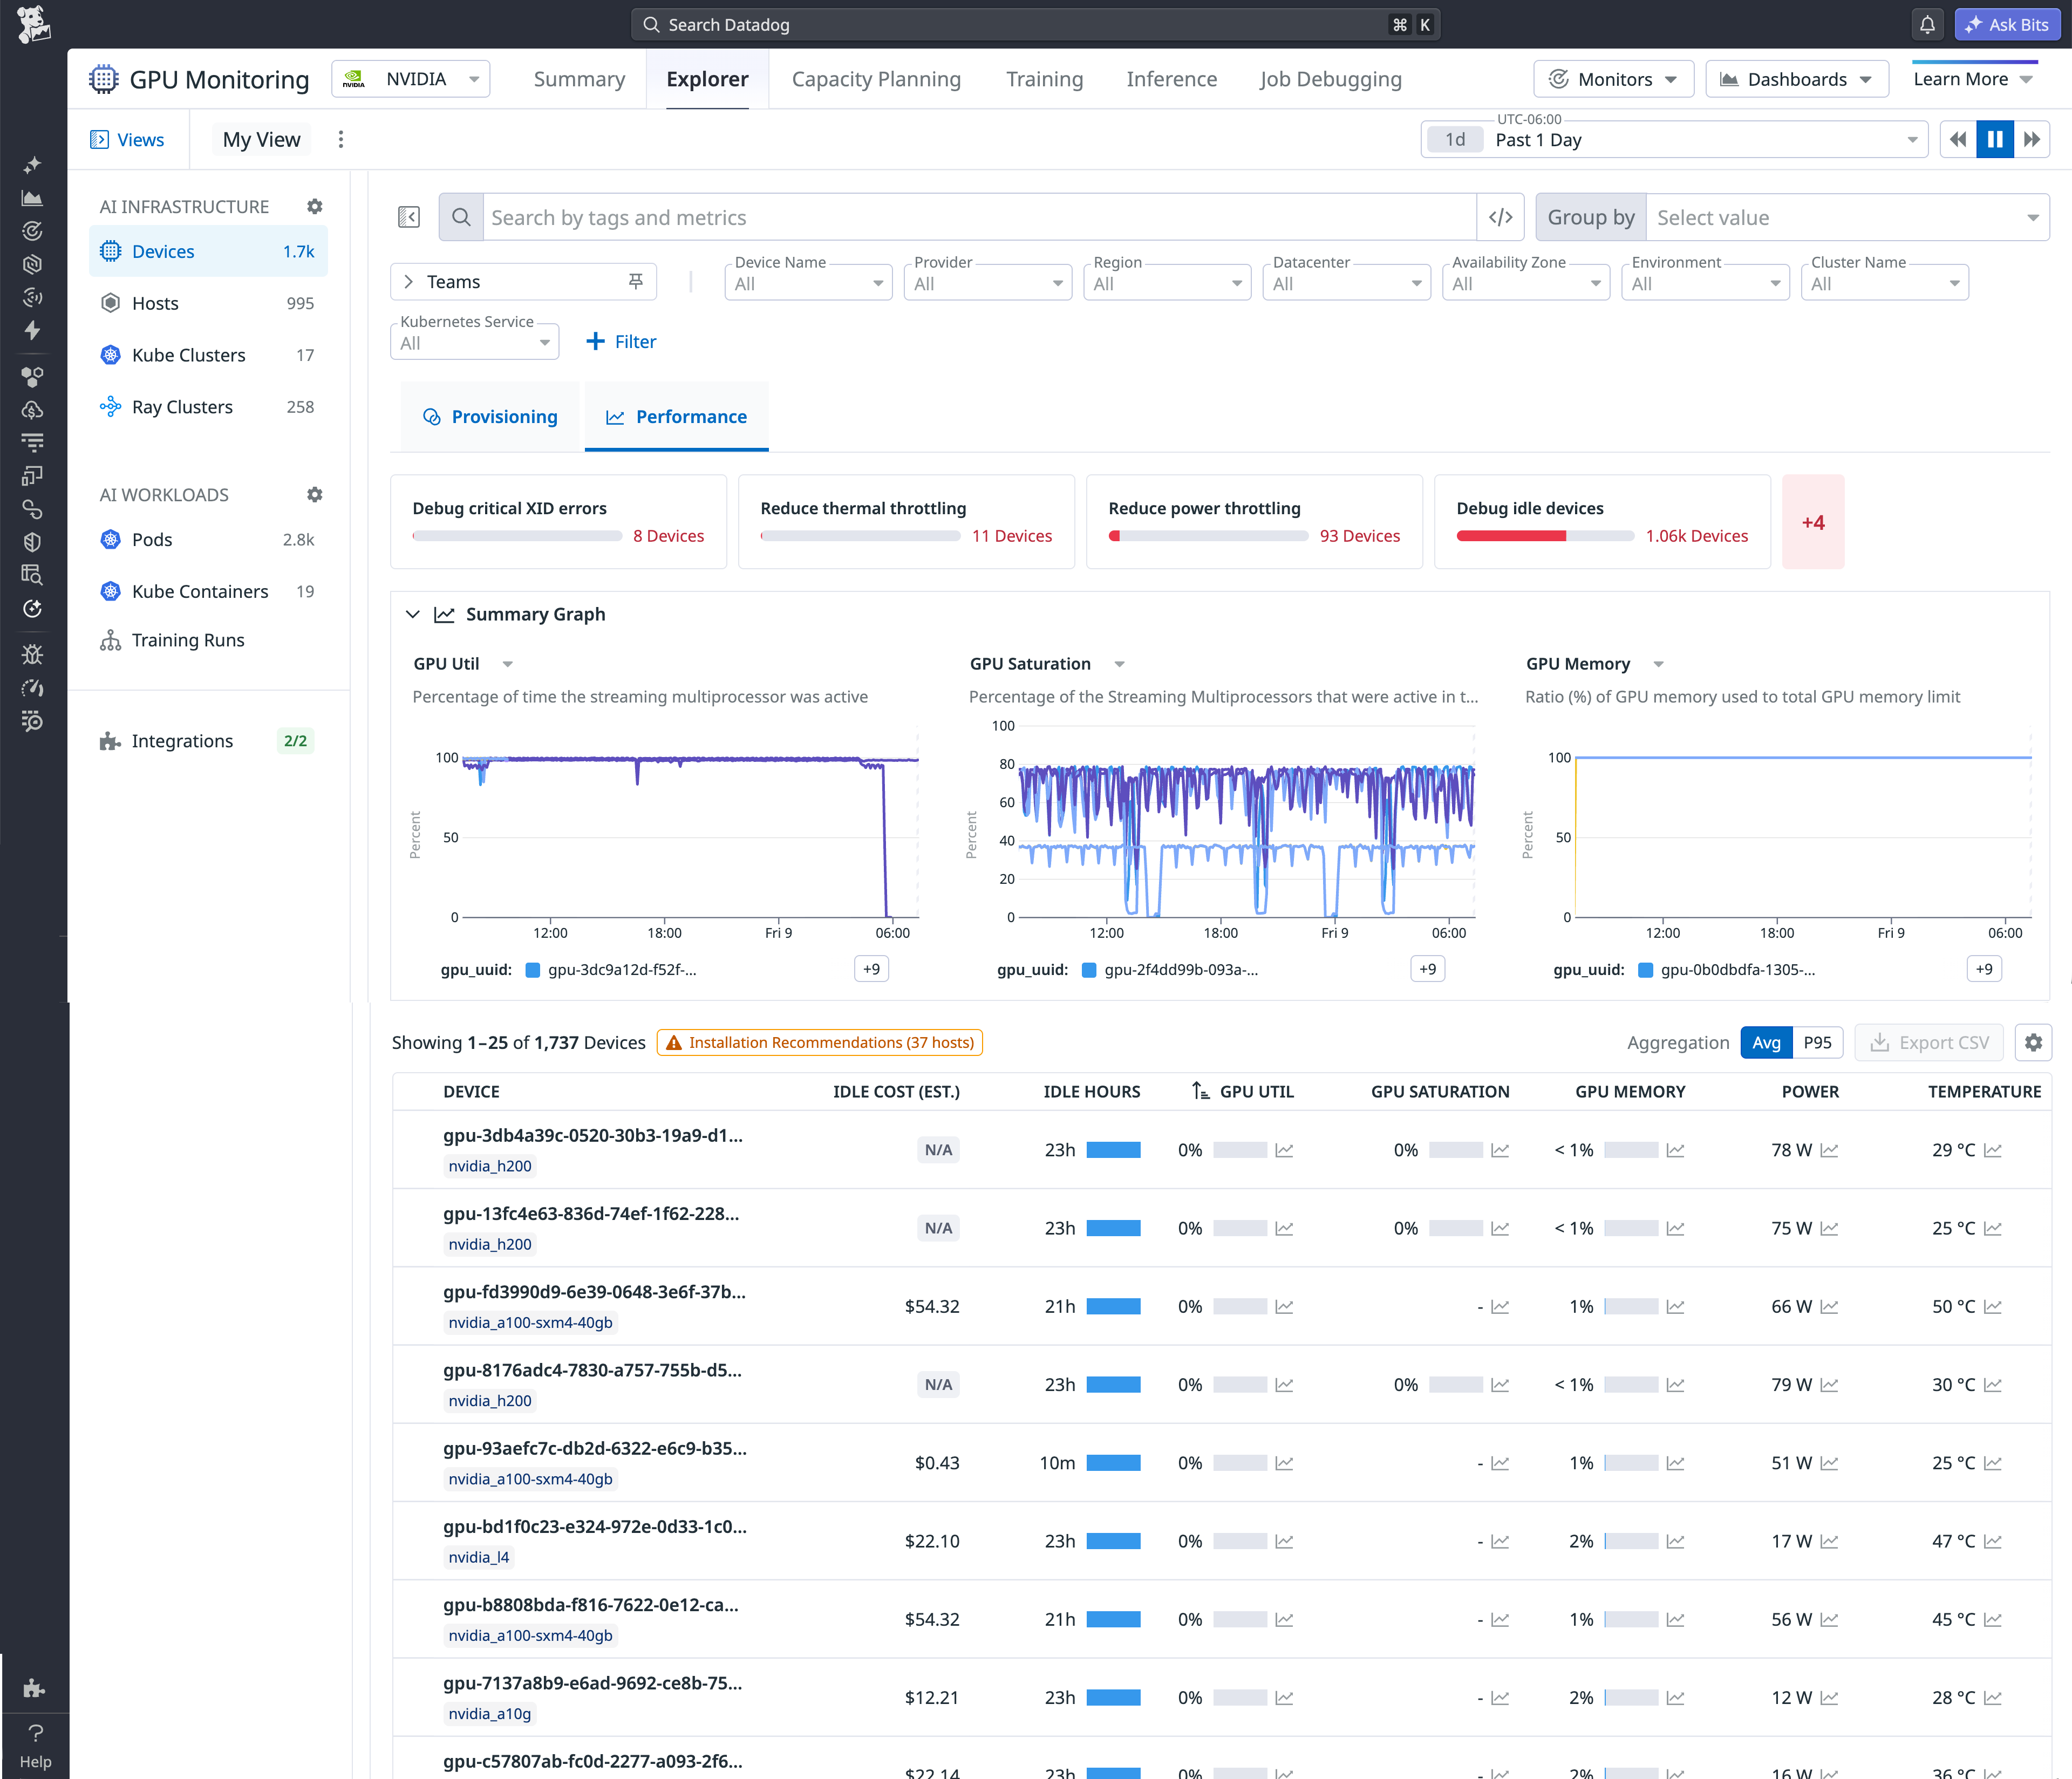
This enables you to distinguish a topology change that improves performance from one that's masked by a failing device. A timeseries widget's Compare Time view puts current and prior-period utilization side by side or overlaid, letting you choose a day, week, month, or custom comparison window without building a separate dashboard.
### **GPU Monitoring cost: Putting a dollar figure on the gain**
GPU Monitoring surfaces cost alongside the utilization data described above, attributing total and idle GPU cost to pods and processes. Pairing that cost view with the utilization baseline above answers the release-capacity question from the previous section: a sustained utilization gain only lowers spend once GPU-hours decline or the freed capacity is released.
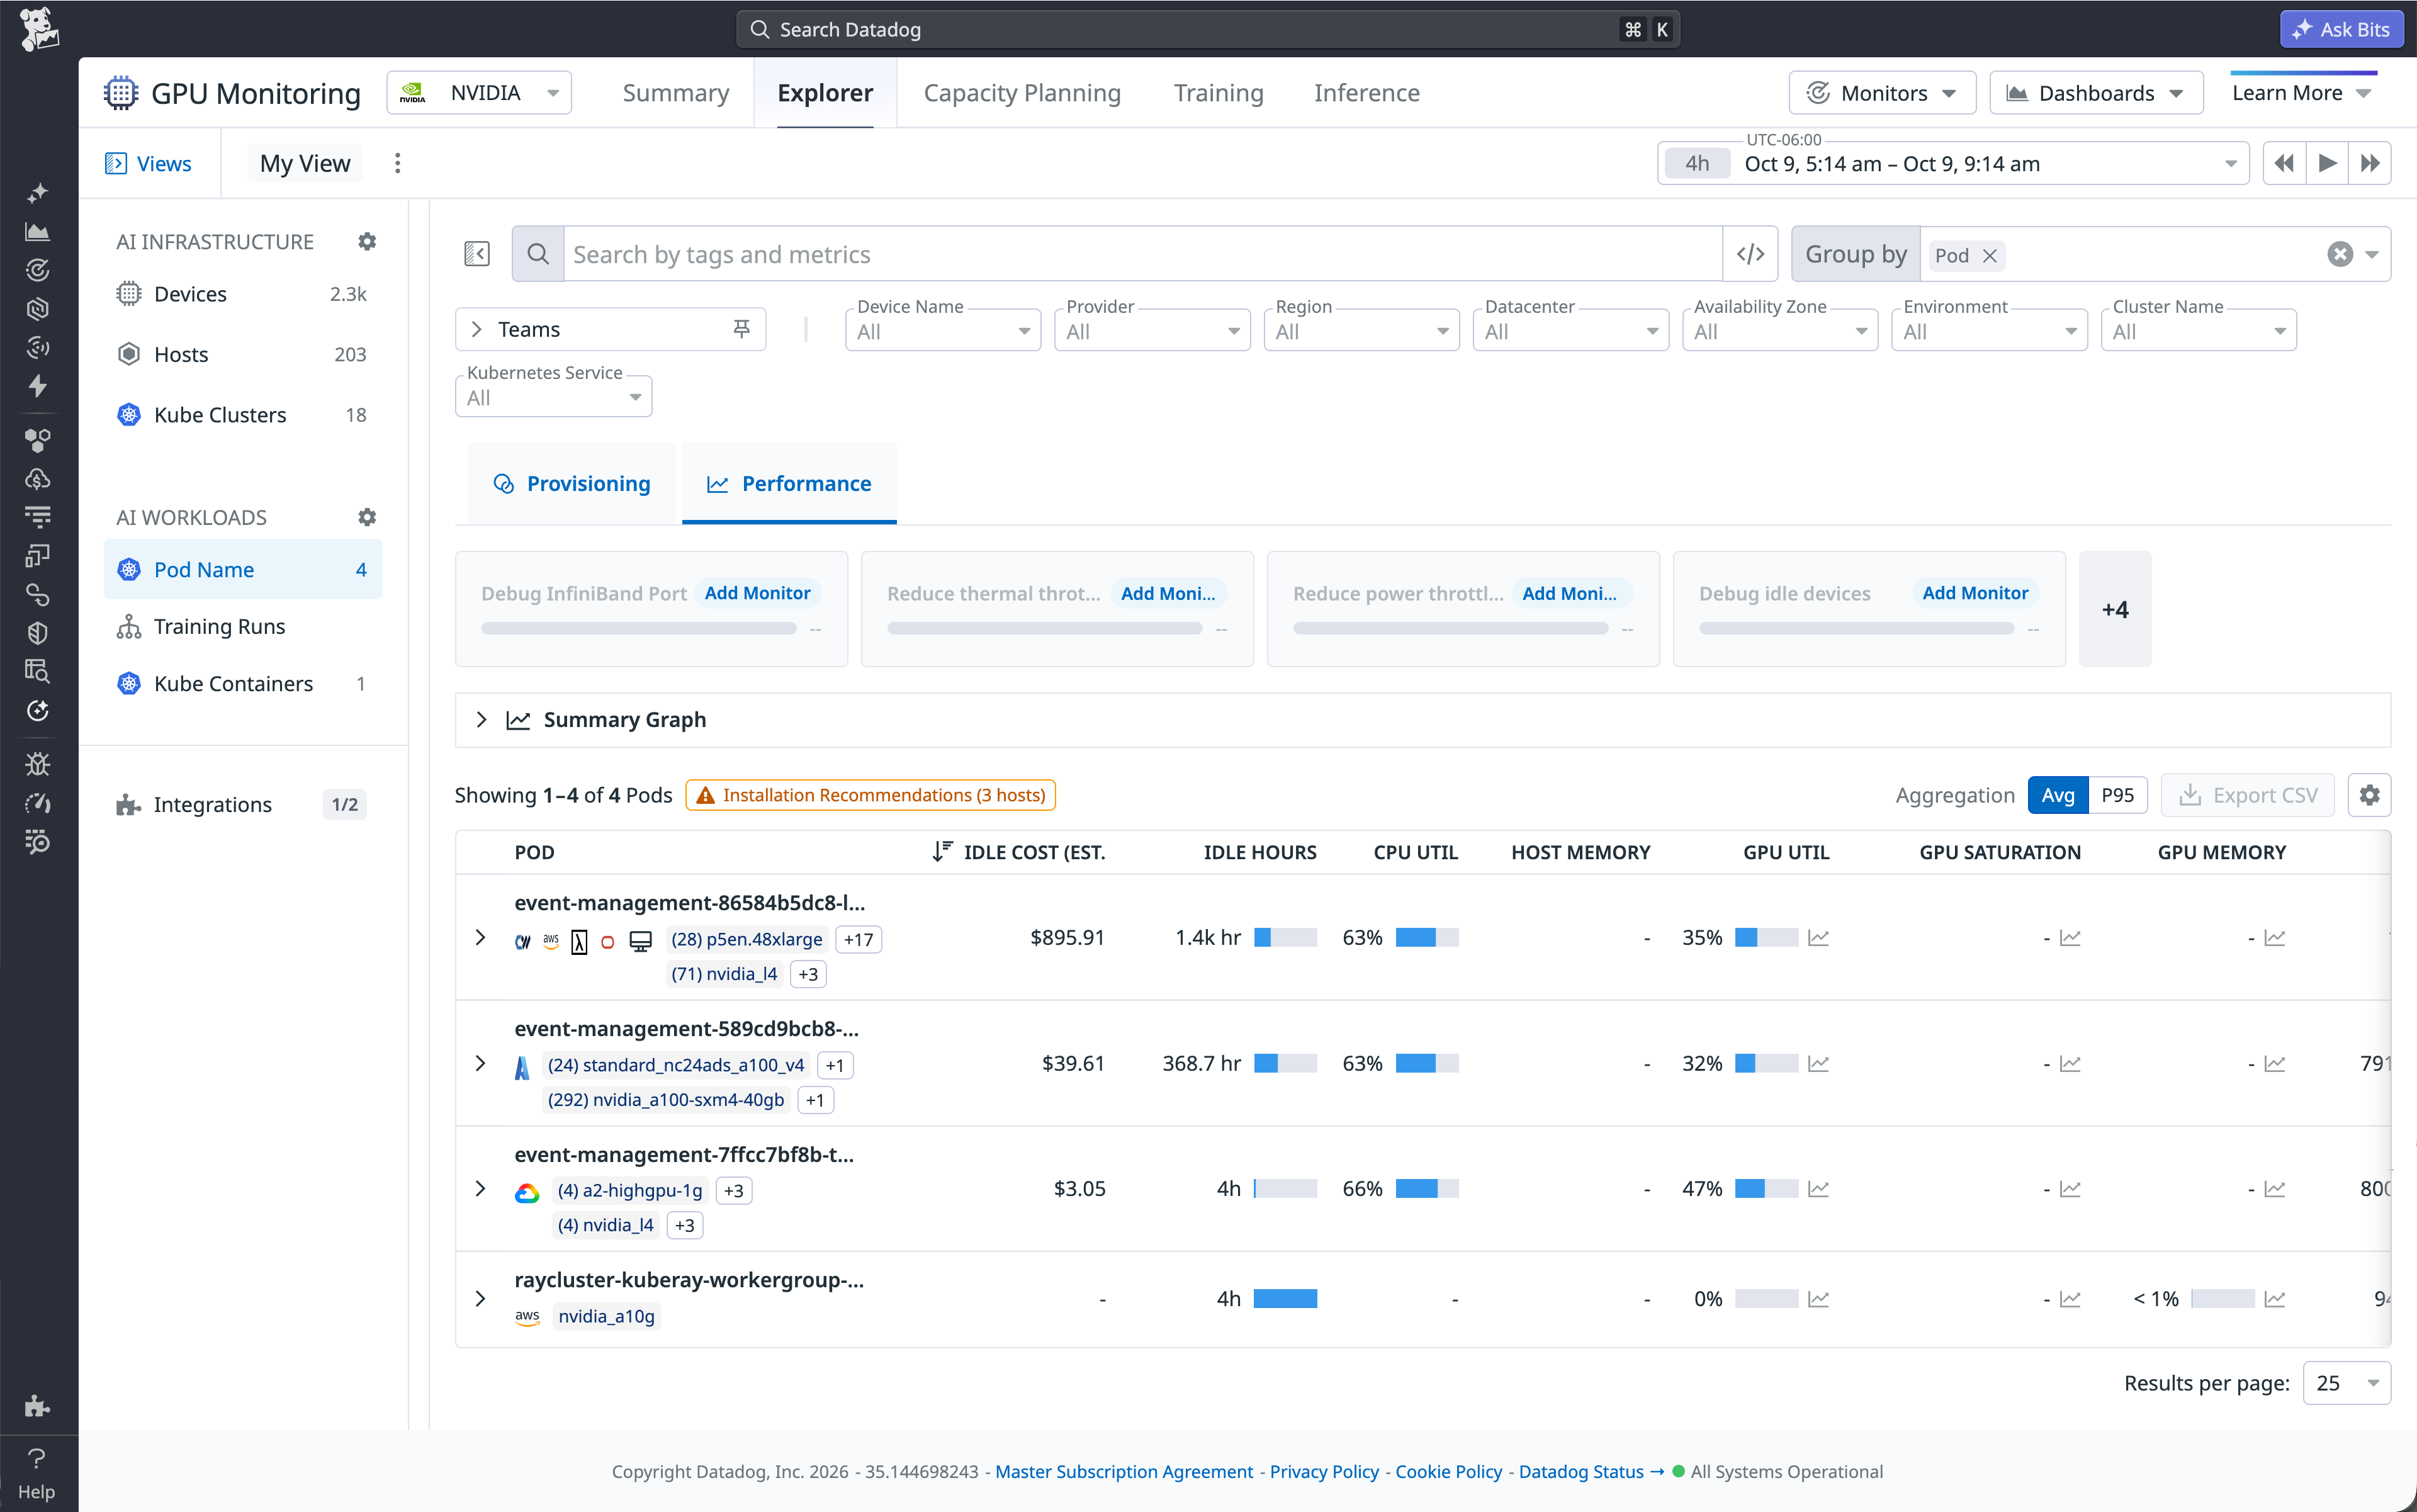
Use GPU Monitoring's cost view to compare GPU infrastructure spend against your established utilization baseline. Cluster and host views show total and idle GPU cost directly, without a separate query, and let you layer in pod-, namespace-, or training-job-level cost as your DRA driver and node configuration support it. Confirm tagging in a new environment before reporting workload-level cost figures.
Comparing GPU infrastructure spend against your baseline with rich context can show whether higher GPU activity coincides with stable or lower infrastructure cost. Similarly, infrastructure spend with little GPU activity can indicate waste, but it does not by itself prove that a ResourceClaim is unnecessary or requests more capacity than its workload uses. Treat a divergence between cost and activity as a reason to check who owns the claim and whether it's still needed, not as grounds to act on its own.
Spotting a cost-activity divergence is only half the value. A[ Cost Monitor](https://docs.datadoghq.com/monitors/types/cloud_cost.md) can alert on unexpected spend changes for the GPU-hosting infrastructure you're tracking. [Workflow Automation](https://docs.datadoghq.com/actions/workflows.md) can notify the responsible team, collect diagnostic context, and request approval for remediation.
If a Workflow Automation remediation would release capacity by deleting a ResourceClaim or scaling down a GPU node group, require a human approval step before it runs. Cost and activity signals can flag a likely candidate, but they can't rule out deliberate headroom or a bursty workload. Additionally, a ResourceClaim can serve multiple consumers who'd be affected by its removal. Before scaling down a node group specifically, also confirm that its devices are no longer allocated and that the autoscaler and DRA driver support the topology in use.
## **Turn DRA's utilization gains into cost savings**
Dynamic Resource Allocation can improve how Kubernetes selects and accounts for GPUs, but higher utilization does not automatically translate into lower spend. Use workload throughput, GPU telemetry data, and infrastructure-cost data to decide whether provisioned capacity can be safely reduced.
Datadog GPU Monitoring supplies the critical context you need to manage capacity effectively, alongside the scheduling and allocation signals Kubernetes exposes. See the[ GPU Monitoring setup documentation](https://docs.datadoghq.com/gpu_monitoring/setup.md), [Cloud Cost Monitor documentation](https://docs.datadoghq.com/monitors/types/cloud_cost.md), and[ Workflow Automation documentation](https://docs.datadoghq.com/actions/workflows.md) to get started.
New to Datadog? to track the utilization and cost benefits of DRA.