

Organizations across a wide range of industries share a common goal: deploy stable applications that support their customers’ needs. Many of these organizations rely on the Datadog platform to get complete visibility into the health and performance of their applications, and we understand how important it is that our services are reliable. That’s why we leverage our own products to ensure that the platform works as expected. Tools like Real User Monitoring (RUM), Session Replay, and Error Tracking have become integral to our customer support workflows, enabling us to assist our customers when they experience an issue in the platform.
In this post, we’ll look at how the Datadog Technical Solutions team uses these tools to quickly respond to tickets.
Missing context for troubleshooting an issue
We have a standard workflow for managing and resolving support tickets. First, we work with customers to understand what they are attempting to accomplish on the Datadog platform and walk them through the appropriate steps where necessary. If we discover—or are able to recreate—a bug during this process, we try to provide a satisfactory workaround until our engineers deploy a fix.
Occasionally, a customer might not know the best way to describe the issue they are seeing in the platform, so their support ticket is submitted without enough details to effectively troubleshoot. For example, we may not have information about:
- the exact steps that led up to the issue
- the console or UI error messages that occurred during the user’s session
- which UI elements (e.g., buttons, links, etc.) triggered the error
A common next step for the Technical Solutions team is to ask the customer for additional information, such as a screenshot or a screen recording of the issue. But they may not have the time to recreate the problem or be allowed to share files due to their organization’s security and compliance policies. These hurdles can significantly increase our time to resolution, so we leverage RUM and Session Replay to fill in any details that a customer may not be able to provide.
Filling in the gaps with RUM and Session Replay
To help us troubleshoot, we created a customized support page within our ticketing system that allows us to look up additional information about a customer, such as the email address, username, and organization ID associated with their profile. Access to this information is especially useful when we don’t have enough context for resolving an issue.
For example, our support page includes a “RUM Sessions” button that uses the customer’s email address and organization ID to create the appropriate URL, as seen below:
https://app.datadoghq.com/rum/explorer?query=%20%40session.has_replay%3Atrue%20%40usr.org_id%3A<ORG_ID>%20%40usr.email%3A<EMAIL>&tab=session&live=trueThis capability allows us to navigate directly from a customer’s ticket to a full list of their sessions within a specific time frame in order to isolate the issue they reported.
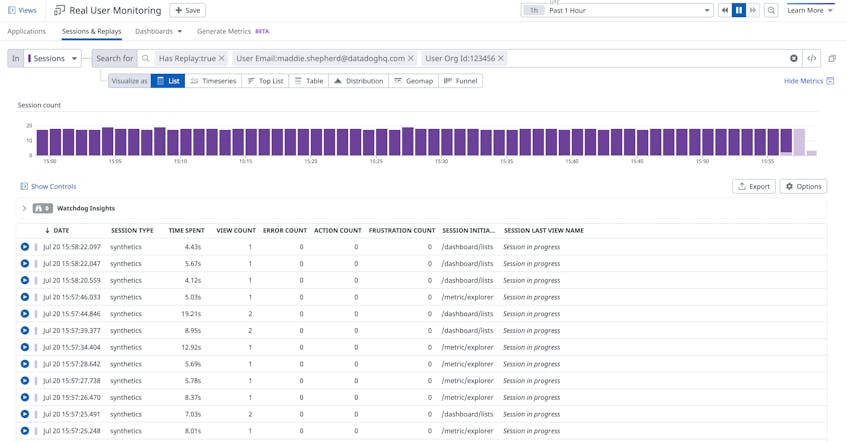
Selecting a session from this list allows us to replay the user’s journey from end to end and gives us access to additional context provided by standard developer tools, such as console errors, all within the same view.
In the screenshot above, we can see that a customer received an error message after attempting to access a saved view on one of their dashboards. It’s important to note that we automatically mask all text by default (excluding common UI elements like navigation) during this process to ensure that we maintain our customers’ privacy while still allowing us to view their activity.
Understanding the root cause of the issue with Error Tracking
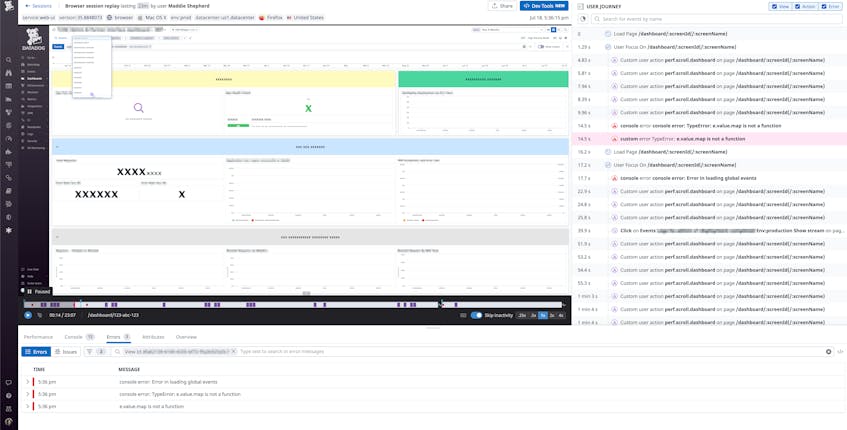
RUM and Session Replay enable us to see exactly when a frontend issue occurs in our platform, but we need to understand why it occurred before we can resolve a customer ticket. We can navigate from a specific console error (e.g., e.value.map is not a function) within a Session Replay view to Error Tracking for more insight into its root cause.

In the screenshot above, we can see that this particular error occurred 224 times over 96 sessions and affects a newer version of code. Conditions like these indicate that it is not an isolated incident and may have been introduced recently. To troubleshoot the issue further, we can easily review traces linked to the specific RUM click action event that generated the error (i.e., selecting a saved dashboard view). Traces allow us to follow the underlying requests that make up an event in order to pinpoint the source of an issue, such as a bad API call to a specific service.
Once we can determine the root cause, we have enough information to declare an incident and work with our engineering teams to deploy a fix. Depending on the issue’s severity, we may release a hotfix in order to immediately remove the blocker for affected customers—or deploy it as part of an upcoming release.
Complete context for quickly resolving customer tickets
By integrating RUM, Session Replay, and Error Tracking into our ticket workflows, we have complete visibility into the exact user journeys that trigger errors in our platform. This context enables us to quickly identify an issue’s root cause and decrease our overall time to resolution, so that our users can continue supporting their customer base. Check out our documentation to learn more about RUM and Session Replay. If you don’t already have a Datadog account, you can sign up for a 14-day free trial.
