

Datadog’s infrastructure comprises hundreds of distributed services, which are constantly discovering other services to network with, exchanging data, streaming events, triggering actions, coordinating distributed transactions involving multiple services, and more. Implementing a networking solution for such a large, complex application comes with its own set of challenges, including scalability, load balancing, fault tolerance, compatibility, and latency.
gRPC is an open source Remote Procedure Call (RPC) framework that enables efficient communication between distributed systems by providing a universal schema for defining services and methods, and abstracting away the complexities of network communication across different languages and operating systems. Datadog started using gRPC because of its integration with Protocol Buffers (protobuf), which allows application developers to easily create bindings for their services in various languages. As Datadog grew, we also discovered that gRPC’s built-in client-side load balancing features, when used properly, were key to scaling our backend.
gRPC provides the channel abstraction, a virtual connection to a service on which requests can be sent and responses are received. gRPC channels are responsible for:
- Constantly watching the service discovery system (we use DNS) to obtain the list of addresses of the service
- Creating subchannels for each backend that the client wants to send RPCs to
- Maintaining states for each subchannel that can be used during load balancing to avoid unhealthy backends
- Choosing a subchannel to send each request to
gRPC has helped Datadog scale to its current size by facilitating communication within the Kubernetes clusters on which our system runs. Datadog has more than 27,000 customers whose telemetry data we gather. This scale means we are monitoring millions of hosts that generate trillions of data points for us to ingest and process each day. Now, gRPC traffic within Datadog is on the order of tens of millions of requests per second between tens of thousands of pods across our Kubernetes infrastructure. Managing such a high volume of traffic has led us to encounter potential roadblocks with gRPC that other organizations might not notice right away.
At Datadog, we’ve learned a number of lessons arising from running a large mesh of gRPC services in a high-scale Kubernetes environment, and through that process, we’ve identified several best practices that we will share with you in this post:
- Use Kubernetes headless services and gRPC round-robin to avoid load balance issues
- Leverage TLS to handle IP recycling
- Set
MAX_CONNECTION_AGEto force gRPC to re-resolve from DNS, ensuring proper scale-out detection - Set the
keepalivechannel option to mitigate the effects of silent connection drops - Properly monitor your services
Use Kubernetes headless services and gRPC round-robin to avoid load balance issues
At Datadog, many of our services run on Kubernetes clusters. Instead of fronting these services with separate load balancers, we use gRPC’s built-in, client-side load balancing features to spread loads from client pods to server pods. This eliminates a piece of infrastructure (i.e., the separate load balancers that would otherwise be necessary), which saves on costs and improves efficiency. However, using gRPC client-side load balancing in Kubernetes requires careful configuration.
For example, when 100 gRPC clients each send 100 requests per second to 10 gRPC servers, with no tuning, the distribution of requests looks like this:

The timeseries above illustrates Kubernetes pods that host gRPC servers receiving unequal traffic loads. Some pods are handling far more requests than others. This correlates with higher CPU and memory utilization for those pods.
Kubernetes services by default come with a load balancer that works at the TCP layer. The Kubernetes ClusterIP Service type is the default way Kubernetes makes a service accessible to other services within your application. ClusterIP creates a virtual IP for the service and configures a proxy layer that communicates with the Kubernetes API in order to load balance outgoing connections to the service. When a gRPC client tries to connect to the ClusterIP via service discovery (e.g., DNS), the proxy layer randomly assigns the incoming connection to a pod hosting that service. gRPC sees a single IP address (you can think of it as the proxy address) and forwards all requests from the client through the established connection to that IP address.
Even though Kubernetes’ load balancing randomly distributes all the clients’ connections to pods hosting the service, you need to reach a very high threshold of connections before you achieve an equal distribution of requests across pods.
This issue is one of the reasons we’ve opted for client-side load balancing as opposed to the built-in Kubernetes solution. The first step in our load balancing approach is to use Kubernetes headless services. This eliminates the use of ClusterIP, so when a client queries DNS for the service, DNS returns the full list of IP addresses associated with the service. The result is that load balancing is no longer handled by Kubernetes—it is handled by gRPC on the client side.
By default, gRPC uses the pick_first policy, which picks a single pod IP address and sends all client requests through it, if the service config does not specify any load balancing policy. The pick_first policy does the same thing as ClusterIP: gRPC sends all requests to a single address. Unfortunately, this results in load imbalance when the number of clients is not vastly greater than the number of servers. The upshot is that neither Kubernetes nor gRPC’s default load balancer works for us.
Instead of pick_first, at Datadog we default to the round_robin load balancing policy for gRPC. The round_robin policy load-balances requests from the client side by creating a subchannel for each address it receives from the resolver and constantly monitoring the connectivity state of the subchannels. Rather than sending all requests through the first open connection it finds, round_robin sends each successive request it receives to the next active subchannel in the list, which guarantees that each client will spread their requests equally across pods.
With Kubernetes headless services and gRPC round_robin load balancing, the number of requests per pod evens out to an equal distribution, as shown in the screenshot below. This makes it much easier to assign the correct capacity to the pods.

Leverage TLS to handle IP recycling
In a Kubernetes environment, pods are assigned IP addresses for the duration of their lifetime. When a pod is terminated (e.g., when you deploy a new version of the pod image to deploy a code change), you initiate a rolling update that will shut down the previously used server and terminate any existing client connections. Then, the server’s IP will be put back in the free, available pool of IPs and may immediately be claimed by a newly starting pod.
Our DNS-based service discovery stack propagates updates in about 20 seconds. As a result, our service discovery system may not update the clients’ IP list fast enough. This means that in some cases, the gRPC client (whose connection we terminated when deploying the new gRPC server) may try to reestablish the subchannel with the newly spawned pod, thinking that it is talking to the old pod.
In the best-case scenario, the newly spawned server is just an instance of the old one, so things just work properly.
Another possibility is that the newly spawned server hosts a completely different service and does not listen on the same port, or uses a protocol that is different from the previous server. In this case, a connection cannot be established and the subchannel remains in transient failure. The load balancer avoids it, so no error is observed by the application.
Another, rarer scenario is that the newly spawned pod listens on the same port as the old pod but hosts a completely different service. In this case, the client and servers are incompatible, resulting in an increased error rate.

The worst-case scenario, which has happened to us a few times at Datadog, is that a different shard of the same service is spawned with the same IP address. In this case, the client may not realize that it is communicating with the wrong server, but it will nevertheless read or even write data to the wrong shard of the same application. This type of failure can result in data corruption and data leakage.
The solution to this problem is to verify server identity through TLS, which comes as one of gRPC’s built-in security features for authentication of server applications.
Set MAX_CONNECTION_AGE to force gRPC to re-resolve from DNS, ensuring proper scale-out detection
When demand starts exceeding the capacity of all server instances, service owners typically want to add more pods. Here is the pattern we saw when trying to scale out a service based on increasing load:

In the graph above, you can see an example of scale-out that has not gone as expected. The number of running server pods increased from 10 to 12, but the number of requests per pod remained at 10k per second, indicating that the new pods are not getting any traffic. Scale-ups often need to happen quickly in order to absorb a traffic spike, so this scenario could be a significant issue.
The root cause of the problem is that the DNS resolver built into gRPC does not actively monitor the results of DNS changes even after the entry’s time to live (TTL) had expired, which means there may be new IP addresses that the DNS resolver is unaware of. gRPC only forces a re-resolution when a connection is closed. This means that even when new pods become available after scaling up, gRPC will not immediately connect to them, making the scale-out ineffective.
Armed with this knowledge, the solution is to actively make the gRPC server churn client connections by setting its MaxConnectionAge to five minutes—a time period that strikes a balance between limiting connection churn and re-resolving often—putting a cap on the lifetime of a persistent connection and forcing gRPC to re-resolve from DNS. By making each connection close within five minutes, you ensure that the clients will regularly look for new pods when they have to reconnect, thus balancing their requests across newly deployed pods after a scale-out.
In the graph below, you can see that after scaling up, within the first few seconds, the load distribution spreads to the new instances.

Set the keepalive channel option to mitigate the effects of silent connection drops
The last major challenge we faced in running gRPC in our Kubernetes environment at Datadog was silent connection drops—occasions when a TCP connection used by a gRPC subchannel becomes broken without the remote server closing it gracefully via a TCP FIN or RST. A silent connection drop may occur because of a network issue (e.g., a router malfunction or a server being abruptly disconnected from the network). As a result, the client neither receives a response from the server nor knows that the server is down.
However, the gRPC client will still try to use the subchannel and the socket because the TCP socket is in an established state, so it appears healthy. When a client tries to send a new query, gRPC will write it to this socket. The payload will be stored in the TCP socket until the server ACKs it, and the socket will try to send the packet to the server—but in this case, the socket won’t receive any response from the gRPC server, because the packets are dropped.
From the client’s perspective, everything is fine. It will keep using this subchannel, and you will accrue more and more payloads in the socket.
With no tuning, gRPC doesn’t do anything to detect silent connection drops, so the connection won’t be closed until the operating system reaches its retransmission limit and notifies the application with an error. The default for our Linux distribution is 15 retransmitted packets limit for any socket (this takes 15 minutes). When the fifteenth retransmission times out, the TCP socket will close, the gRPC library will receive ETIMEOUT when trying to use the socket, and the subchannel will switch to a transient failure state. All outstanding requests in the socket buffer will fail, and the gRPC client will stop using this subchannel.
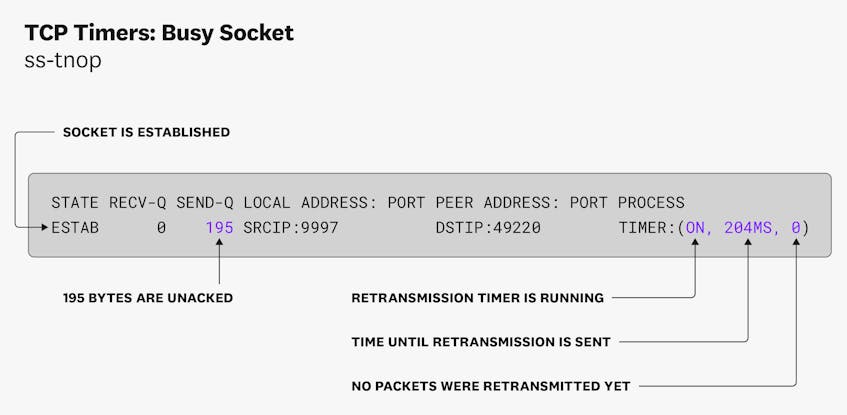
One way to observe silent connection drops is to use the ss command to get information on the socket. This will show you how many bytes are un-ACKed, the retransmission timer, the number of times a packet was retransmitted, and other details. Within a datacenter, when data remains unacknowledged on a TCP socket for more than a few seconds, chances are high that the connection was dropped silently.
You can also use Datadog’s NPM dashboard to help you identify if this scenario is occurring.

To solve this issue, we use the gRPC keepalive parameter for gRPC connections, which can be configured as part of client-side channel creation.
Setting the gRPC keepalive will have two consequences. First, gRPC will send an HTTP/2 ping when there are ongoing queries and no data through the link after the keepalive time has expired, and expect a response within the keepalive timeout. More importantly, setting gRPC keepalive will also change the TCP socket by setting the TCP_USER_TIMEOUT option to the keepalive timeout, which defaults to 20 seconds. TCP_USER_TIMEOUT has a major impact as it will timeout the TCP socket after 20 seconds spent with transmitted but unacknowledged data. gRPC keepalive won’t even have time to send an HTTP/2 ping.
However, this created a new problem—many of our users at Datadog began setting the keepalive time lower and lower in order to proactively avoid silent connection drops. This ends up being counterproductive because of the keepalive enforcement policy system. Because HTTP2 pings are not cheap, especially if you have thousands of clients creating pings every second, by default, gRPC servers are configured to have a minimum ping interval of five minutes—if a server receives a ping within this limit, it will give a strike (one strike per ping). When the server reaches the third strike before the five-minute limit, it will close the connection with a Too Many Pings error, close the TCP socket, and shut down all ongoing queries in the subchannel. A closed connection like this could lead to active queries on this connection to fail. As a result, if you set the keepalive time too low, you end up trading one kind of failure for another one.
At the end of the day, what we’re really interested in is the TCP_USER_TIMEOUT parameter of the gRPC keepalive feature. We encourage users to set the gRPC keepalive timeout value to a high value, such as five minutes, so it will never trigger because of the client timeout setting. This allows us to use TCP_USER_TIMEOUT to avoid silent connection drops without triggering a Max Ping Strike.
Properly monitor your services
In order to stay on top of the issues we’ve raised above, it’s essential to monitor your gRPC services. This involves identifying gRPC communications between your microservices and tracking vital metrics—such as the latency and success (status codes) of communications—alongside other critical information, including health indicators from your infrastructure and service metadata. This will allow you to understand issues when they arise (e.g., if gRPC connections are causing load imbalance on your hosts, or if failed transmissions are a signal of something bigger, like a silent connection drop).
Datadog offers a built-in gRPC integration that allows you to add an interceptor that collects an APM trace for each gRPC request. Each of these spans can be investigated in Datadog, alongside golden metrics (throughput, error rate, latency) and a wealth of other monitoring data from across the stack. Distributed tracing is vital in the kind of large deployment we have, because it pinpoints where in our system a given error is coming from—which would otherwise be extremely difficult to identify in such a complex environment.
Acknowledgments
Running a high-scale Kubernetes environment at Datadog has given us the opportunity to face some challenging but also discover interesting dimensions of using gRPC. In this post, we’ve explained the importance of setting the round_robin policy to handle load balancing on the client side, how TLS solves the IP recycling problem, how setting the MaxConnectionAge on the server side helps with proper scale-out detection, and how configuring the timeout parameter of the keepalive feature helps solve silent connection drops.
We’d like to thank Anthonin Bonnefoy for his contributions and Ara Pulido for facilitating the Datadog on gRPC episode on which this post was based.
