

Debugging errors in production environments can frustrate your team and disrupt your development cycle. Once error tracking detects an exception, you then need to identify which specific line of code or module is responsible for the error. Without access to the inputs and associated states that caused the errors, reproducing them to find the root cause and a solution can be a lengthy and challenging process.
To help you remediate bugs and discover their root causes faster, Datadog Exception Replay automatically captures the local variable data and execution context of production errors in APM Error Tracking. Exception Replay enables you to quickly reproduce exceptions that have surfaced in your services with real production state and inputs. Python variables are collected and annotated for each frame in the stack trace, allowing you to analyze the steps leading up to an error and obtain a contextual understanding of the environment in which the error occurred.
In this post, we’ll discuss how Exception Replay lets you:
- Use local variable data to reproduce exceptions and accelerate debugging
- Gain contextual understanding of production state when the error occurred
Use local variable data to reproduce exceptions and accelerate debugging
Once you’ve configured the Datadog Agent and instrumented your application, you can enable Exception Replay and begin seeing local variable data populate in the stack trace of your Error Tracking issues. Exception Replay enriches the existing stack trace with the exact production variables that triggered the error and includes several stack frames before the error occurred. By default, any sensitive data like passwords and access tokens will be redacted automatically, but you can scrub any other sensitive data that you’d like to safeguard using Sensitive Data Scrubbing.
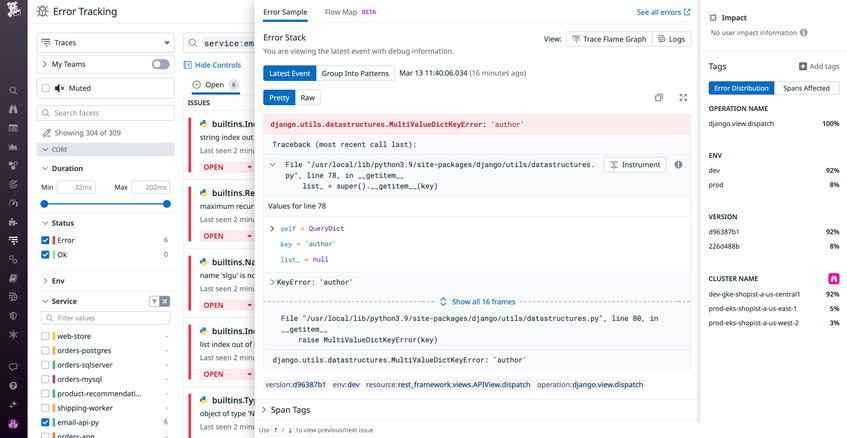
Error Tracking issues conveniently show the variables revealed by Exception Replay and let you pivot directly to your preferred integrated development environment (IDE) to start the fix, including GitHub, Visual Studio Code, PyCharm, or IntelliJ.
Let’s say you get an Error Tracking notification that a new profile could not be added to your database. Upon investigating with Exception Replay, you notice that the line of code with the list_ variable contains a null value. You know that a valid list name is required for the list_ variable to add a new database profile, so you fix the issue by adding a validation step that will check the validity of the list_ variable before attempting to add a new profile to the database.
Gain contextual understanding of production state
When dealing with a highly complex system, the context in which an error occurs involves many interactions, dependencies, and external factors. Exception Replay and Error Tracking provide execution context that lets you understand your production state better, leading to more efficient troubleshooting, an improved user experience, and vital information that can help your team implement preventative measures to minimize the risk of future errors.
You can correlate local variable data from Exception Replay with other information in an Error Tracking issue, including the users impacted, application versions, amount of errors over the past day, your span tags, affected hosts and containers, impacted traces, and other relevant metrics. You also have the option to create a case, declare an incident, or investigate in APM directly from the issue.

For example, let’s say that a user of your email API reported that they can no longer send emails. You navigate to Error Tracking in the Datadog application and see an issue with the description of name 'slgu' is not defined. Scrolling down, you review Exception Replay’s local variable data, which reveals a slug variable that contains a valid value, but do not see slgu. You review the stack frames before the error and realize there was a typo in the code and that any instance of slgu needs to be updated to slug. You create a case so your team can collaborate and assign the right individuals to fix the issue. Going a step further, you correlate the application traces in APM with the error to review the execution flow that led to the error. The traces show that stronger adherence to code reviews could have prevented the error, so you provide feedback to leadership to make the code review process more efficient and collaborative for your organization’s development team.
Enable Exception Replay today
Exception Replay allows you to use local variable data to accelerate and simplify debugging. Conveniently located within Datadog Error Tracking, Exception Replay provides the details you need to gain a complete, contextual understanding of the environment in which the error occurred. This execution context enables you to effectively reproduce the error, quickly pinpoint the root cause, and implement an appropriate solution.
Exception Replay is now available in public beta—check out our documentation to get started. If you’re new to Datadog, you can sign up for a free trial today.
