

Envoy proxies communication among microservices. It is a key component in many service-oriented architectures—and one that offers a unique opportunity to gain visibility into your service mesh. We’re pleased to announce that Datadog integrates with Envoy as well as AWS App Mesh, a new hosted service based on Envoy that dynamically configures your service mesh proxies. By integrating Envoy or AWS App Mesh with Datadog, you can monitor the performance of your service mesh and view performance metrics and detailed request traces from all the services in your infrastructure.
What is Envoy?
Envoy is an open source proxy that aims to reduce the complexity of microservices for developers and operators. It functions as the data plane in a service mesh, routing data between the microservices that make up an application. Envoy is often deployed with a control plane technology such as Istio or AWS App Mesh, which allow you to configure and control your microservices. Originally created by Lyft, Envoy has been hosted by the Cloud Native Computing Foundation (CNCF) since 2017.
Envoy can be deployed as both an edge proxy (which provides a single point of ingress for traffic from the internet) and a service proxy (which routes requests between the services in an application). Each service proxy is deployed as a sidecar alongside each running instance of a service. In this arrangement, applications do not need to be aware of the network, since Envoy provides network routing, as well as load balancing, health checking, and service discovery.
What is AWS App Mesh?
AWS App Mesh provides a scalable, managed control plane for your Envoy service proxies (which comprise the data plane of the service mesh). While each Envoy proxy manages network tasks for its resident service (such as load balancing and service discovery), AWS App Mesh dynamically configures each proxy and coordinates the behavior of the data plane.
Monitoring your service mesh with Datadog
Envoy was designed in part to alleviate observability challenges in distributed microservice architectures. Because of its role in facilitating communication between services, Envoy provides a consistent way of collecting data about request traffic and service performance. By integrating Datadog with Envoy or AWS App Mesh, you can collect hundreds of metrics tracking Envoy’s internal activity, as well as the performance of your services and the applications that your services depend on, such as MongoDB and DynamoDB. You can then create visualizations and alerts in Datadog to monitor the performance and health of all your services in one place.
Service performance
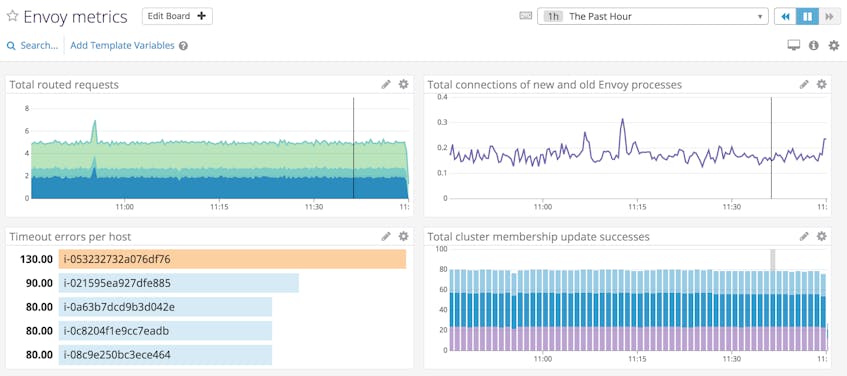
For all the services in your service mesh, Envoy provides metrics such as request counts, response codes, and the number of bytes sent and received. Collecting metrics like these in Datadog enables you to monitor and set alerts on key performance indicators such as 5xx error counts. You can also monitor the overall traffic flow to your application and its component services to ensure that you have enough capacity.
Envoy activity
The Datadog integration also allows you to monitor the activity of Envoy itself via metrics that track the actions Envoy takes to manage your services and the data plane. Health check metrics inform you of any failed health checks, or if Envoy has to eject a problematic host for failing too many checks or returning too many server errors. You can also see metrics about Envoy’s configuration API activity to know when, for example, Envoy reloads its configuration to apply an update.
Application activity
Several of Envoy’s built-in filters gather metrics from the applications Envoy talks to, and you can write additional filters to fetch metrics from more applications and forward them to Datadog. Out of the box, Envoy includes network filters that collect metrics from Redis and MongoDB, and an HTTP filter that provides DynamoDB metrics. To create a custom HTTP filter to collect metrics from other applications, you can follow the example provided in the Envoy source code.
Tracing requests throughout your service mesh
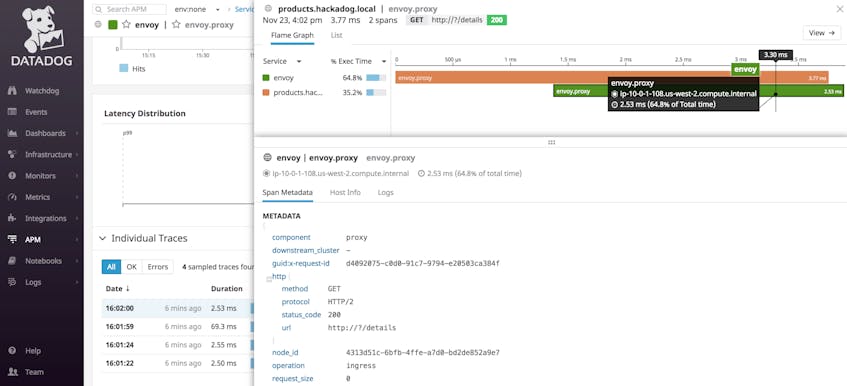
In addition to tracking key metrics, you can also trace requests to all the services in your service mesh with Datadog APM & Distributed Tracing. Your Envoy service proxies add a unique request identifier to each call sent and received by your services so that all those calls can be reconstructed into a causally ordered request trace. Envoy then forwards the trace data to Datadog for visualization, monitoring, and alerting.
With Datadog APM, you can visualize distributed request traces in detailed flame graphs to see each call’s timing and dependencies. You can explore an automatically generated Service Map to see how requests flow between all your services. And you can gain even deeper insight into the performance and usage of your services with App Analytics and Watchdog.
Get started today
You can start monitoring your services and Envoy proxies and tracing requests as they travel through your service mesh by following the integration instructions for Envoy or AWS App Mesh.
If you’re not already using Datadog, get started today with a 14-day free trial.
