Remy Mathieu
Our aspiration for the Datadog Agent is for it to process the maximum amount of data, very quickly, with as low of a CPU as possible. Striking this balance between performance and efficiency is an ongoing challenge for us. We are constantly searching for ways to optimize processing while using the same or less CPU. Recently, we shipped a change improving the part of the Datadog Agent that computes a unique key for every metric it receives, making it possible to process even more metrics within the same CPU usage. In this article, we explain how we identified this bottleneck, removed it, and measured the results.
Identifying the bottleneck
Starting with version 6, we’ve built the Datadog Agent in the Go programming language (“Golang”). Golang and its runtime provide tools for memory profiles, CPU profiles, concurrency profiles, and much more, which makes it ideal for us. We leveraged these tools to profile the Datadog Agent in order to improve its metrics pipeline. We began this improvement to gain raw CPU time: we set out to process every metric faster, which lets us process more of them in the same amount of time—this increased throughput overall.
Dissecting a CPU profile
It is rare that something immediately stands out as a potential improvement when looking at CPU profiles. Despite this, it is always interesting to start by looking at the most CPU-intensive piece of your structure and trying to figure out if any changes can improve this part.
It’s always important to evaluate the profiles you are looking at in the context that they were captured. For example, looking at a 30-second CPU profile of an idle application is rarely interesting.
We captured CPU profiles of Datadog Agents running in our benchmark environment, where they receive many metrics using DogStatsD. This way, we are sure that we are looking at the CPU usage of the Agent while it works hard processing metrics. If we improve the results in this scenario, we will improve the performance of our DogStatsD implementation, which was our initial goal.
Here are aggregated CPU profiles captured on the Datadog Agent, represented in a flamegraph:
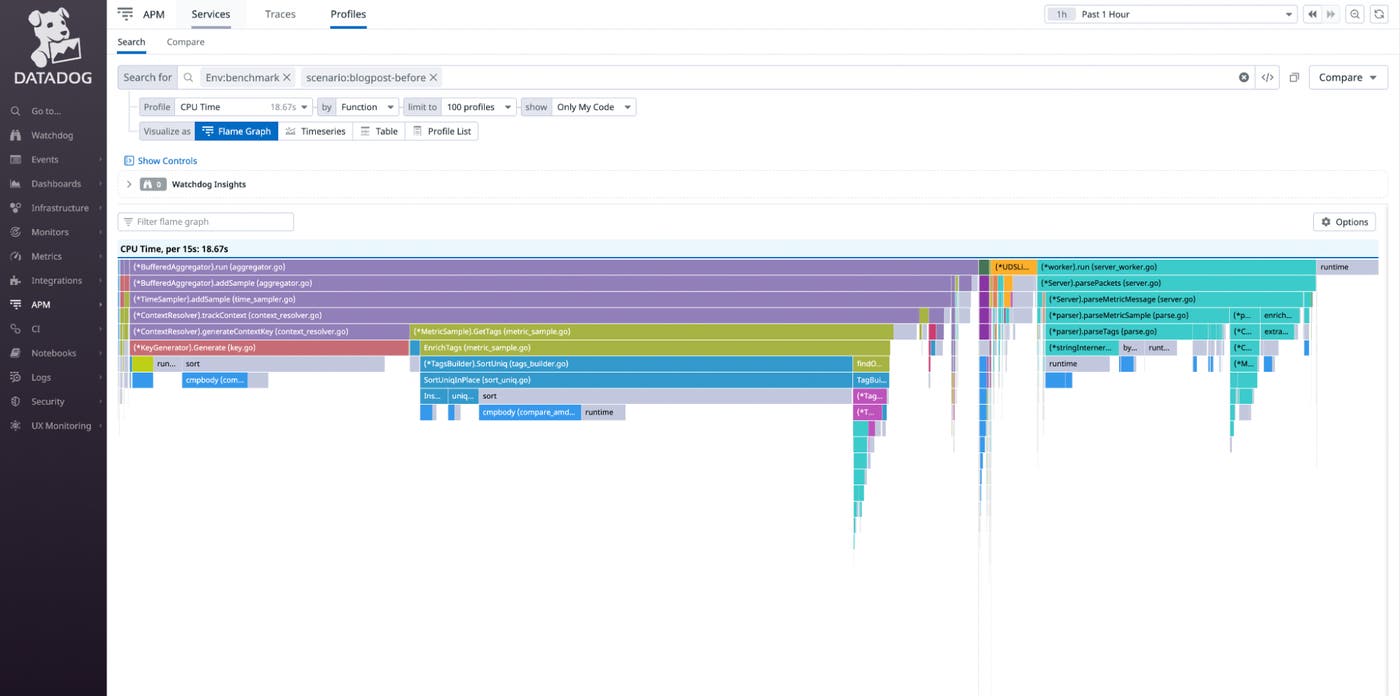
A flamegraph of a CPU profile displays how many times the CPU has been seen executing a function. The more observations executing the function, the wider the function will show in the flamegraph. There is a call graph from top to bottom representing which function calls which other function.
Without much surprise, we can see that the addSample / trackContext functions use the most CPU since the Agent receives a lot of samples on its DogStatsD server. With this in mind, let’s try to understand the problem and consider how to improve it.
Assessing the problem of the original algorithm
For metrics aggregation, we create a metric context for every metric received in a DogStatsD message. It is our way of uniquely identifying every metric that the DogStatsD server has to process. These contexts are used as keys in context storage in RAM (in this case, a hash table). Metric information and values can be addressed in the context storage using the metric context.
It is a well-known design that works well. Still, since we compute a context for every metric every time the metric appears in a DogStatsD message, the raw performance of the algorithm is crucial to achieving great performance and to process a lot of metrics per second.
In our use case, there are a few things we must consider about metric context generation:
- We need to use the metric name, but we also have to handle all the tags from the DogStatsD messages, plus the container tags emitting the metrics.
- To use it as a key in our context storage, the metric context should be a hash of all the information mentioned above. It means this hash has to be both fast and not generate collisions. (so, generating a different hash even if the source information is only slightly different)
- We must always generate the same context key for the same metric. So the original algorithm sorts the tags and makes sure they are unique (i.e., verify that a tag does not appear twice in the metric tags list).
- Sorting has a well-known cost known to anyone having dealt with lists. There are already various implementations out there, with detailed pros and cons.
If you remember the CPU flamegraph above and look carefully, you can see that the sorting algorithms are using a lot of CPU (with the util.SortUniqInPlace and sort function calls).
Different strategies to improve the performance
We can achieve performance improvements with different methods, including: bigger hosts, specializing part of the code for the hot paths, better raw performance, or a better design.
Bigger hosts were not an option for us, since we want to improve the performance of the Datadog Agent on existing servers. However, we improved the performance with the other listed methods.
Specialization
Sometimes, optimization comes from having a fast path or specialization for specific cases in the code. If the particular case is one of the most used then adding a bit of complexity can be a good trade-off to improve performance.
In our case, all metrics need to have a context generated every time they are received, but this doesn’t mean no specialization is possible!
We observed that the performance per metric varied depending on the number of tags because of the sorting part of the algorithm. We decided to specialize this case. Now, the sorting algorithm used is dependent on the number of tags to sort, achieving the best result possible for every amount of tags.
Better raw performance
Using micro-benchmarks, we were able to test the speed of various hash algorithms that fit our needs (speed and uniqueness since we want to avoid hash collision). These micro-benchmarks measured the generation speed of different hash functions with the same uniqueness characteristics: the more unique hashes generated in a second, the better.
The micro-benchmarks showed that murmur3 was the best hash implementation for our use case. During these tests, we observed something else interesting: some of the hash implementations benefitted from the Go runtime having a specialization for some code path (map accesses for 64-bit keys). For context, at this point we were using a 128-bit hash for our map accesses to avoid a collision.
Switching to 64-bit metrics context in our context storage (which is still way enough to avoid hash collisions) helped us benefit from the runtime.mapassign_fast64 and runtime.mapaccess2_fast64 runtime optimization while manipulating these hashes with maps, speeding up our context storage and metrics sampling code.
Better design
One of the ways to improve performance is by redesigning the program (or at least one of its algorithms).
In our situation, the sort was our biggest performance bottleneck. On top of that, it had two purposes: the first one was that computing the metric context needed an ordered tag list, and the second one was that it was faster to deduplicate the tags when they were sorted.
Because of this and because we already did a lot with other performance improvements above, we decided to dig into a new algorithm design, which is when one of the largest performance wins occurred.
Implementing a new design and code for the context generation
We already tried to specialize the sorting algorithm, but now we had to start thinking outside of the box.
Here is the original metric context generation algorithm:
context = hash(metric_name) tags = sort(tags) tags = deduplicate(tags) for tag in tags: context = hash(context, tag)The hash call was already the best we had available, so we specialized the sort call to be as efficient as possible and did the same for the deduplicate call. Further improving this algorithm was a dead end. It had to be changed entirely.
Order matters in the line context = hash(context, tag). If the order did not matter, we could probably avoid needing to sort. Instead of merging the hashes, we’ve started to use an XOR bitwise operation because the order doesn’t matter when using this operation, meaning that a^b = b^a.
context = hash(metric_name) tags = deduplicate(tags) for tag in tags: context = context ^ hash(tag)The sort has been successfully removed, but there is still a deduplicate call because the XOR bitwise operator has the property a^a = 0. With deduplication, we can ignore the redundant tags instead of XORing them multiple times. Unfortunately, we still needed the sort to deduplicate the tags as efficiently as possible.
That is where we introduced a new piece of code to deduplicate the tags: a custom hash set implementation.
We could have used a Golang map, but it would not have been efficient:
- Internally, the Go map has to hash every tag to use them as a key, while we are already creating a hash for the tag to compute our metric context.
- Memory-wise, the garbage collector would have to collect and clean a lot of garbage by using a map for every context metric’s generation.
With a custom hash set, we could leverage some specialization:
- We can reuse the hash we already generated for the metric context.
- We can be memory efficient by using a fixed array: we approximately know the maximum number of tags processed for each metric. With this maximum, we can set the array size or fall back on a slower implementation for edge cases (specialization, again!)
- Resetting this custom hash set is fast, as it is a fixed-size array of integers. So we can reuse one instead of creating a new one every time.
Here is the basic pseudo-algorithm:
context = hash(metric_name)for tag in tags: htag = hash(tag) if hashset[htag] == False context = context ^ htag hashset[htag] = Truehashset.reset()I’m simplifying the pseudo-algorithm (the hash set implementation with a fixed array isn’t part of the sample) a bit, but you can see that even if the code looks a bit more complex, we removed the sort, and we still deduplicate tags!
Validating the performance wins
Micro-benchmarks
Since this new algorithm is self-contained, we used the Go benchmarks tooling to benchmark the old and the new algorithm and to compare their results. Here is a snippet of the benchmark we used, which itself generates benchmarks with different amount of tags to test multiple scenarios:
func BenchmarkContextGeneration(b *testing.B) { name := "metric.name" host := "myhostname" for tagsCount := 1; tagsCount < 4096; tagsCount *= 2 { // prepare a tags list tags := generateTags(tagsCount)
// run a benchmark with “tagsCount” amount of tags b.Run(fmt.Sprintf("%d-tags", tagsCount), func(b *testing.B) { // generator contains the algorithm generating the contexts, generator := NewContextGenerator() b.ResetTimer() for n := 0; n < b.N; n++ { generator.Generate(name, host, tags) } }) }}This benchmark has been executed against the two versions of the algorithm. Using benchstat to format the output, here are the results comparing the two versions of the algorithm:
KeyGeneration/1-tags-16 17.7ns ± 1% 15.3ns ± 1% -13.75% (p=0.008 n=5+5)KeyGeneration/2-tags-16 24.6ns ± 1% 21.9ns ± 1% -11.34% (p=0.008 n=5+5)KeyGeneration/4-tags-16 41.6ns ± 2% 35.6ns ± 1% -14.37% (p=0.008 n=5+5)KeyGeneration/8-tags-16 76.1ns ± 2% 62.1ns ± 1% -18.48% (p=0.008 n=5+5)KeyGeneration/16-tags-16 152ns ± 2% 114ns ± 2% -25.12% (p=0.008 n=5+5)KeyGeneration/32-tags-16 303ns ± 1% 251ns ±12% -17.27% (p=0.008 n=5+5)KeyGeneration/64-tags-16 1.74µs ± 2% 0.43µs ± 2% -75.52% (p=0.008 n=5+5)KeyGeneration/128-tags-16 3.87µs ± 1% 0.86µs ± 1% -77.85% (p=0.008 n=5+5)KeyGeneration/256-tags-16 8.85µs ± 2% 1.76µs ± 2% -80.12% (p=0.008 n=5+5)KeyGeneration/512-tags-16 19.8µs ± 2% 11.4µs ± 2% -42.58% (p=0.008 n=5+5)The benefits are clear, the new algorithm spends less time computing the metrics contexts.
Checking the profiles again
Let’s take a look at the CPU flamegraph after applying the design change for the contexts generation:
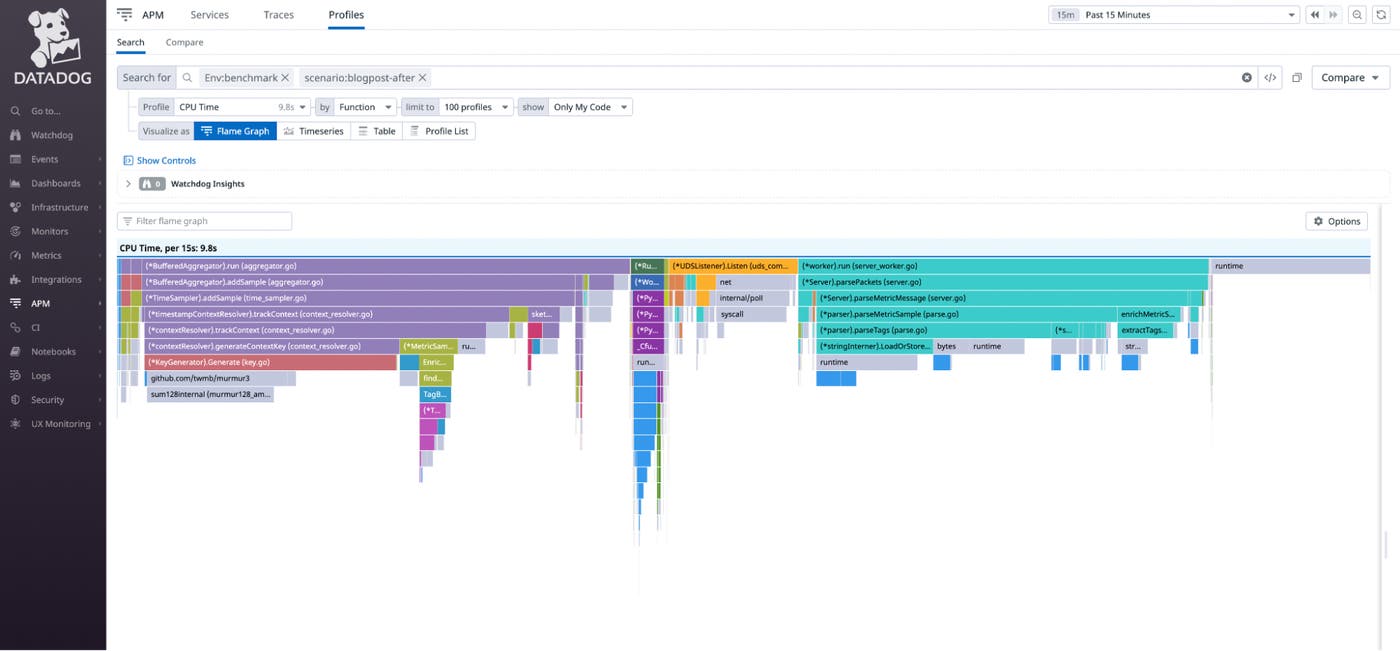
Something immediately visible here is that the calls to sort functions have been completely removed.
Another very interesting thing is that the dogstatsd.(*worker).run now represents a higher share of the Agent’s CPU usage, and it’s the same for the listeners. In effect, the Agent is processing the network traffic faster!
Benchmarks + graph
This work only makes sense if we first validate its benefits performance. It is not a coincidence that we did this in our benchmark environment. In this environment, we can visualize the performance changes through several dashboards and graphs quickly.
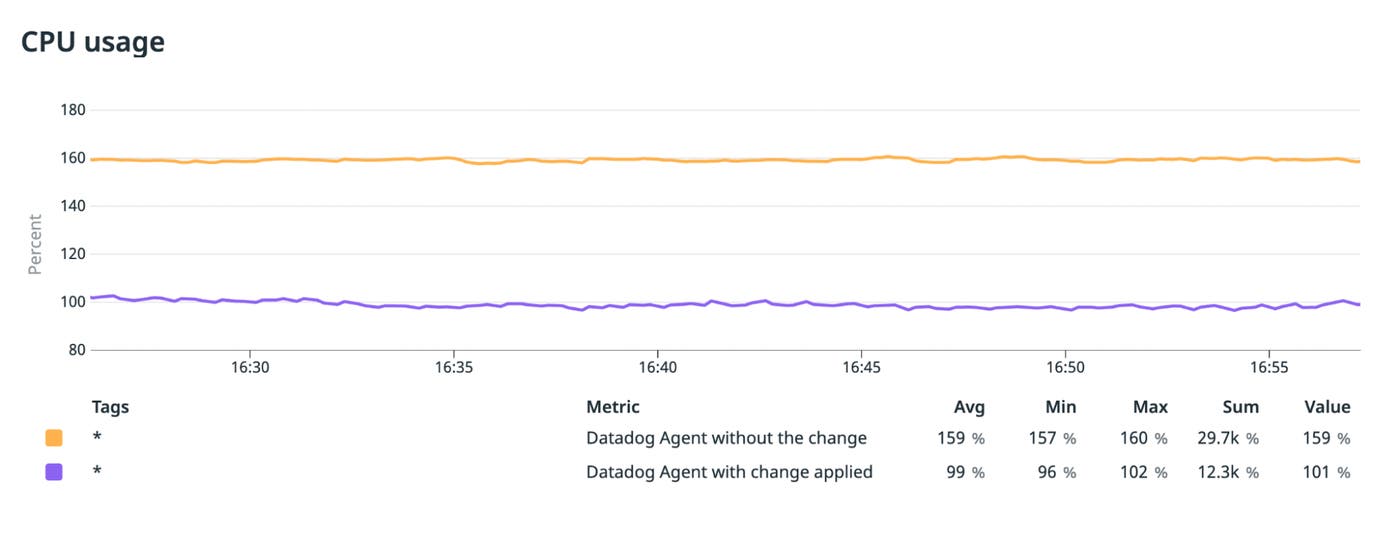
The rate we used in the graphs below is approximately 200k DogStatsD metrics/s sent to an Agent running on small cloud VMs with four cores. To have exploitable results, our benchmark runs the scenario on multiple hosts, and the graphs display an average for all the hosts per scenario.
The compared scenarios are a Datadog Agent without the change (orange) and a Datadog Agent with the change (purple). When looking at the CPU usage, you can immediately see that the Datadog Agent with the improvement performs way better than the one without it. On average, the CPU usage decreased by 40%, using 1 core instead of 1.6 to process the same number of metrics.
But what about Datadog Profiling?
When we decided we needed to do this project to improve our performance, our Profiling product wasn’t yet available in Go. However, now that we do have an official Profiling product that we can dogfood, it would be very interesting to implement Datadog Profiling as a next phase for performance improvements. Dogfooding would give us more facets to filter by, we’ll also be able to track the deployments over time and immediately see if there is a deployment that degrades performance. We’ll also be able to combine data with other Datadog products that we’re dogfooding, like APM.
Conclusion
Every performance optimization is different and goes through various steps of investigation and exploration. We found this particular one interesting, and we hope this article demonstrates how beneficial performance optimizations can be, from the simplest to the most complex ones. We were able to adapt the design and improve the Datadog Agent’s code, leading to better overall performance while processing metrics, and do it without any trade-off on CPU usage. Hopefully, you can reuse some of our techniques to improve performance in your applications. If you’re interested in solving Agent performance problems, join us: Datadog is hiring.
