Laurent Bernaille
On March 8, 2023, Datadog experienced an outage that affected all services across multiple regions. In a previous post we described how we faced the unexpected.
We left off with the realization that we had lost 60 percent of our compute capacity. Armed with this knowledge, our teams knew the first step they needed to take: restore our platform in all affected regions in order to provide applications with enough compute capacity to recover. To get there, teams needed to work through decisions whose outcomes and downstream effects were not immediately obvious. Many of these decisions were defined by the differing impact across cloud providers. Different regions required different responses. First, we’ll look at how we recovered in EU1.
EU1 platform recovery
In EU1, nodes impacted by the system patch had been disconnected from the network and we could recover them with a reboot. It took us some time to realize this, as we had no observability and no access to Kubernetes APIs given the way we built our control planes. But once we understood that we could recover nodes by restarting them, we progressively recovered the clusters.
Cluster recovery
Our infrastructure runs on dozens of Kubernetes clusters. A Kubernetes cluster consists of two sets of components:
- Worker nodes, which host the pods running the application workloads
- Control plane controllers, which manage the worker nodes and the pods
We run two flavors of Kubernetes clusters with a strict hierarchy between them:
- Parent clusters: Clusters in each region that host pods running Kubernetes control planes for other clusters (“child” clusters). In other words, the worker nodes of a parent cluster host pods running the control plane components of other clusters.
- Child clusters: Clusters where Datadog applications are deployed. Their control plane components run in their parent cluster.
The following diagram illustrates this hierarchy and shows how the different components are deployed.
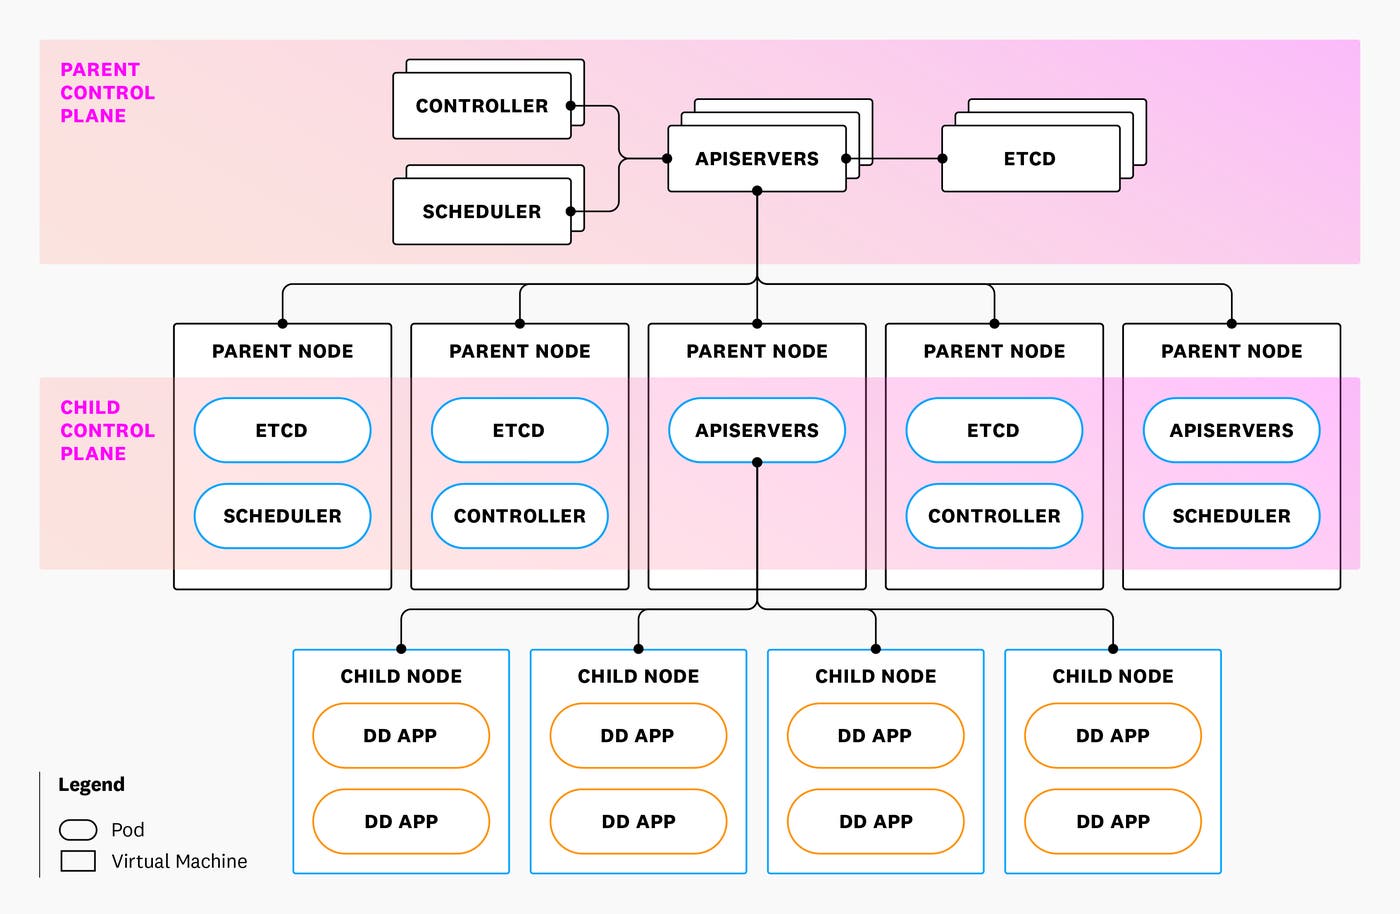
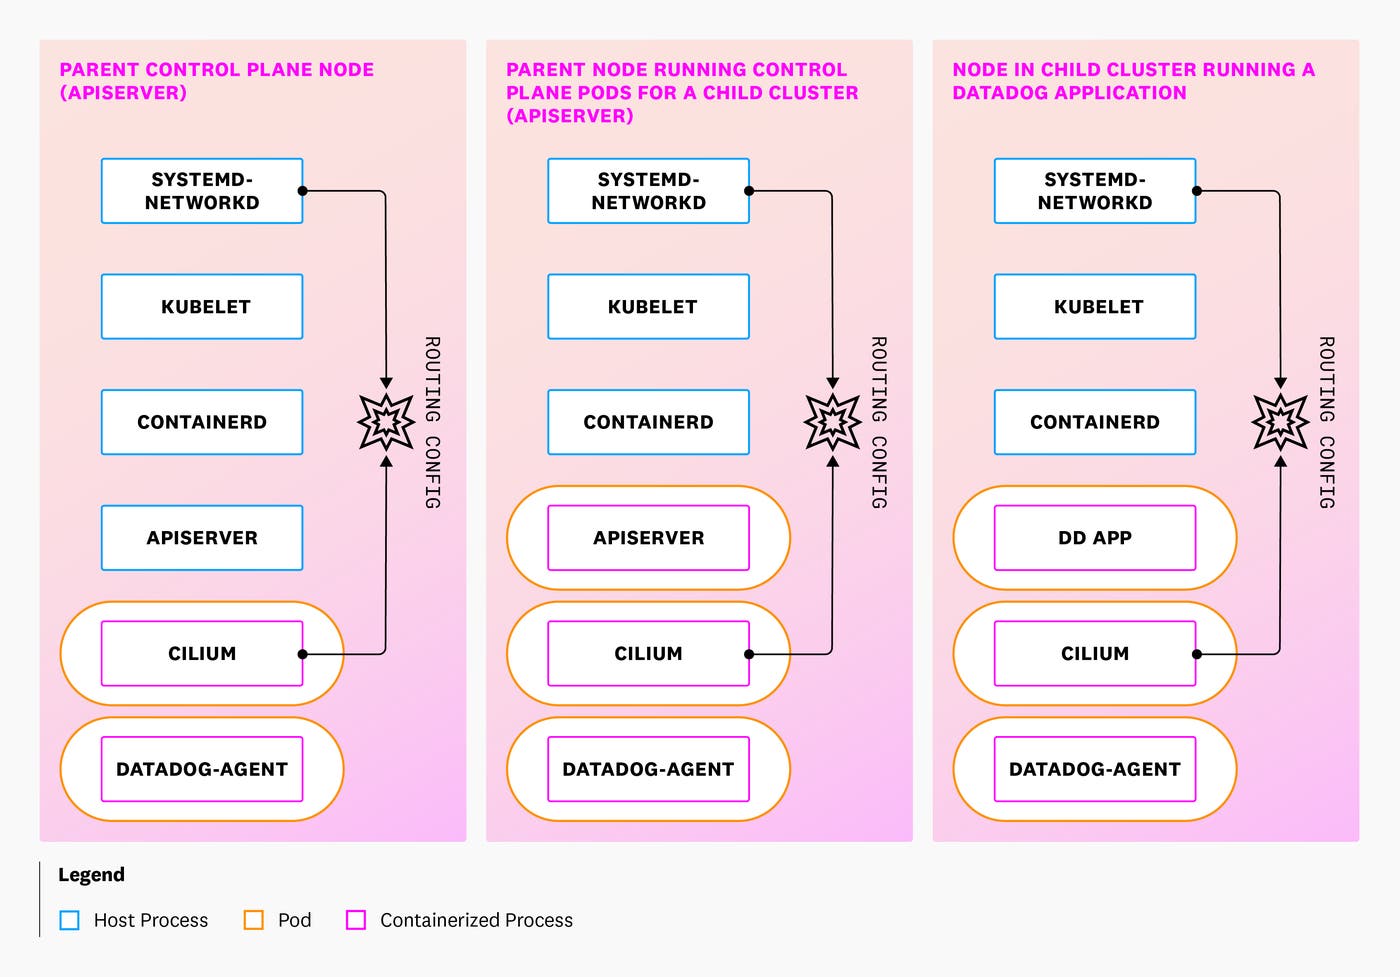
Why do we insist on a strict delineation between clusters? In contrast with running all control planes for both parent and child clusters on virtual machines (VMs), this setup enables us to take advantage of the Kubernetes ecosystem—particularly deployment tooling, auto-replacement of failed pods, rolling updates, and auto-scaling—for the control planes of clusters running the actual Datadog application. Control plane components of parent clusters run on virtual machines and are managed by systemd. These VMs join the parent Kubernetes clusters and run all relevant DaemonSet components, including Cilium. We also deploy the Datadog Agent to these VMs as a DaemonSet, which enables us to have consistent observability everywhere.
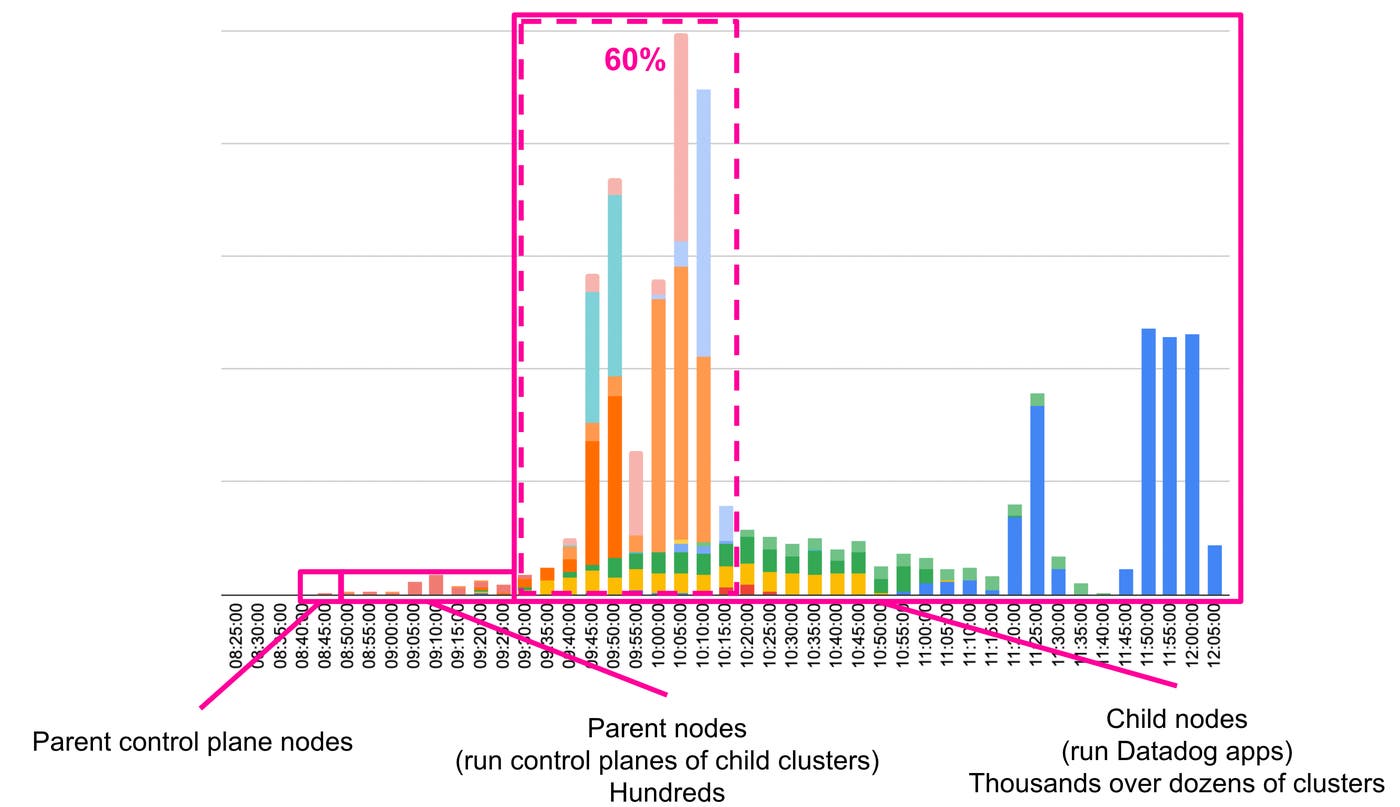
This incident impacted both parent and child clusters because we run Ubuntu 22.04 almost everywhere. Recovering clusters involved the following steps in a strict order:
- Restore the control planes of the parent clusters: These nodes are part of the parent clusters and run Cilium, so when
systemd-networkdrestarted, they lost network connectivity. To restore the control planes of the parent clusters, we had to reboot the nodes (“parent control plane” nodes in the diagram below). This was completed by 08:45 UTC. - Restore the control planes of child clusters: These services run in pods deployed on nodes of the parent clusters. To recover them, we had to reboot all nodes in the parent clusters (parent nodes hosting the “child control plane” in the diagram below). This was completed by 09:30 UTC.
- Restore application nodes in each cluster: This meant restarting thousands of instances running in dozens of clusters (“child nodes” in the diagram below). This was 60 percent done by 10:20 UTC and 100 percent completed by 12:05 UTC. It took more than two hours because we had many clusters to recover and we prioritized recovery based on workloads running in each cluster so we could restore key systems first. In addition, we paced the node restarts to avoid overwhelming the cluster control planes.
The following diagram illustrates how we run key processes on these different types of nodes.
The following graph illustrates the recovery process in EU1. It shows how we progressively recovered the Kubernetes control planes and the nodes running Datadog applications. Note that each color represents a different cluster.
Increasing cluster capacity
After the initial recovery steps, we had to significantly scale out our clusters in order to process the large backlog of data that had been buffered since the beginning of the incident. In doing so, we encountered two limits that delayed full recovery:
- Maximum number of VM instances in a peering group: Starting at 15:00 UTC, we discovered that we were unable to create new instances in EU1. By 15:30 UTC, we identified that at 14:18 UTC we had reached the limit of 15,500 instances for our mesh. This limit is documented, but we failed to check it before the incident. Once we understood the problem, we filed a top-priority ticket, and the Google Cloud team was extremely supportive in quickly helping us find a solution to this unusual problem. They raised the limit shortly thereafter.
- Maximum number of IPs for three clusters processing logs and traces: To process the backlog, our pod autoscaler quickly increased the maximum number of desired replicas for some of our workloads. The subnets used for clusters hosting these workloads became full, and we were not able to scale beyond these limits. These clusters typically run at around 40 percent of their IP capacity (with daily variation between 35 and 45 percent). During the incident, we tried to scale to more than twice the normal number of replicas. Subnets were full between 18:45 UTC on March 8 and 00:45 UTC on March 9. During these six hours we processed the data backlog slower than we otherwise could have. The following graph represents the proportion of the IP space that was available during the incident for these three clusters. As soon as we unblocked the previous limit (maximum number of VM instances in a peering group), we successfully created many instances but then quickly reached the subnet limit.

We actively monitor IP usage of all our clusters to make sure that we have enough capacity to scale. When provisioning a cluster, we usually consider that we need to be able to scale any workload running on it by 50 percent, which gives us a target of 66 percent for maximum IP usage. If we look at a longer time frame for these three clusters, we can see that this capacity increase was much bigger than 50 percent.
The following graph represents the proportion of the IP space used for these clusters over a longer period and shows how March 8, 2023, was exceptional.

Timeline of the recovery of EU1 compute capacity
We can summarize the recovery of compute capacity in EU1 with this timeline (all timestamps in UTC):
- 10:20: 60 percent of compute capacity recovered
- 12:05: 100 percent compute capacity recovered
- 12:30–14:18: We scale multiple workloads to process backlog
- 14:18–18:00: Scaling is blocked for all clusters because we’ve reached Google Cloud’s network peering group limit
- 18:00: Google Cloud raises the network peering group limit, and we can scale all clusters again
- 18:45–00:45: Scaling is blocked for three clusters because we have reached subnet capacity
The following graph illustrates this timeline by showing the number of instances running in EU1:
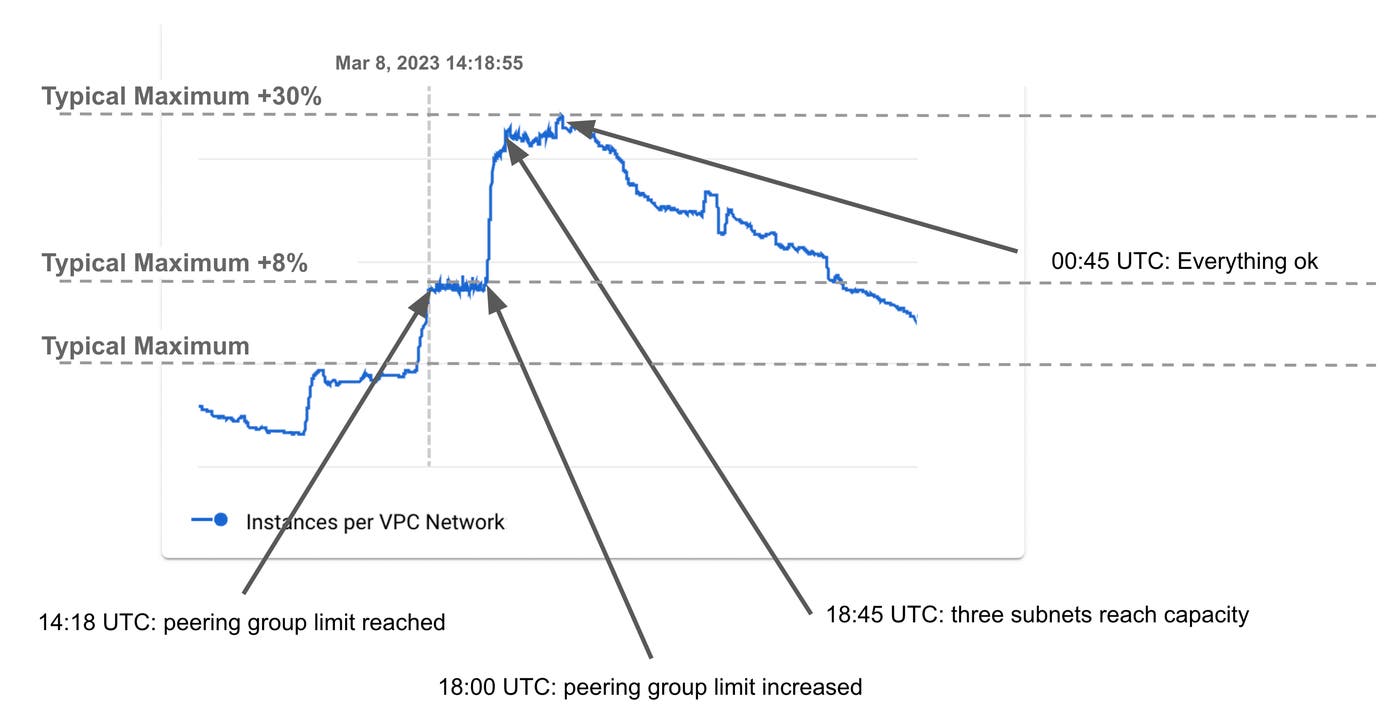
Between 18:00 and 00:45, we can see that the number of instances varies: three clusters cannot add new instances because they have reached subnet capacity, but the (many) other clusters in the region are operating normally, adding and removing nodes as needed. This graph also shows that, before the incident, we were getting very close to the peering group limit and would have discovered it a few months later—though likely in a less stressful context.
Recovery of US3 and US5 followed different timelines but largely the same process. In sum, restoring our platform in these regions “only” required restarting affected nodes. But, because of the specific nature of our Kubernetes clusters, we had to be very careful about the order in which we did restart them. In addition, we ran into several limits that delayed our ability to process the accumulated backlog of data. As we’ll see next, the process of restoring our US1 platform was quite a bit different.
US1 platform recovery
We use the same cluster architecture in US1 and EU1 (parent and child clusters) and the recovery steps were similar to EU1: First, we had to recover the control planes, then the nodes that were hosting our applications. However, unlike in EU1—where the cloud provider simply left impacted nodes running without network connectivity—in US1, instances were terminated because they were failing status checks and then recreated by auto-scaling groups. This meant there was an important difference between EU1 and US1 that affected our recovery efforts:
- In EU1, we restarted nodes and, because these nodes were already members of Kubernetes clusters, they immediately rejoined.
- In US1, however, impacted nodes were replaced, meaning that all impacted nodes were new nodes that had to go through node registration and an initial startup phase.
Cluster recovery
To understand why registering new nodes was challenging, we’ll now walk through the steps required for a node to become fully Ready and accept pods.
Node registration
We rely on the Kubernetes cluster-autoscaler to add and remove nodes to our clusters, so we always have the compute capacity we require. When the cluster-autoscaler sees that a pod is pending, it goes through all the Auto Scaling groups (ASGs) present in the cluster to find one to schedule this pod. It then calls the Amazon EC2 API to increase the size of the ASG, which triggers the creation of a new node (using ec2:RunInstances). This step of increasing the ASG size did not happen when the ASG replaced instances impacted by this incident: there was no change in capacity. Rather, the cluster-autoscaler terminated instances and created new ones.
How does the cluster know to trust a new node? The new node uses its credentials to authenticate with Vault, which we use to sign all our internal certificates. Vault validates the credentials with the AWS IAM API—using sts:GetCallerIdentity and ec2:DescribeInstances—and issues a token to the instance. The instance then asks Vault to sign its certificate using the token.
Next, the instance registers with the Kubernetes cluster using the certificate. At this point, the instance is part of the cluster, but it is not ready to accept workloads because networking is not Ready—meaning that the CNI (Cilium) does not have IP addresses it can allocate to pods.
The Cilium operator sees that this node is in “IP deficit” and calls the AWS EC2 API (ec2:CreateNetworkInterface) to add a network interface (ENI) and allocate IP addresses to this interface. Once the interface has been attached, and the IP addresses have been added to the instance, the Cilium agent on the node transitions the node to NetworkReady, and the node becomes fully Ready and can accept pods.
At this point, the scheduler sees that the pending pod can be scheduled on this new node and binds the pod to the node. The kubelet on the node sees that it needs to run this pod and starts all the required operations (in particular: create network namespace, allocate IP to pod, download container images, and run containers).
These steps involve multiple services and AWS API calls. In normal circumstances, this happens transparently and without issue, but in this case Auto Scaling groups recreated tens of thousands of instances very quickly, which stressed all the services much more than usual. In particular, this stress affected the recovery of:
- The cluster control planes
- Overall cluster compute capacity
Kubernetes control planes
As in the case of EU1, the nodes hosting the Kubernetes control planes for parent and child clusters were running Ubuntu 22.04, meaning that a significant proportion lost networking and were terminated. As nodes were recreated, control planes recovered without human intervention. However, it took some time for the new nodes to become fully Ready (join the parent clusters and become NetworkReady), and sometimes the control planes were unstable for a period of time because of the sheer amount of Kubernetes events happening in parallel (node and pod terminations and recreations, in particular). While we also lost multiple etcd nodes, all of our etcd clusters recovered without intervention as we use remote disks (Elastic Block Store) to store etcd data.
The following graph shows the number of unavailable API servers in each Kubernetes cluster. An API server is unavailable when it’s not running, or when it is running but cannot reach etcd. We configure our control planes with different numbers of API servers depending on cluster size, which explains why the maximum number of unavailable API servers varies between clusters.

This diagram illustrates that the control planes of our Kubernetes clusters were severely impacted by the systemd-networkd patch but auto-recovered after ASGs replaced the nodes. By 08:00 UTC, all clusters except one had recovered. The remaining cluster recovered at 09:30 UTC.
Kubernetes compute capacity
Between 06:00 and 08:00 UTC, AWS recreated tens of thousands of nodes. The following graph shows the number of nodes created with the RunInstances API call according to CloudTrail, the service that records all the AWS activity for an account.
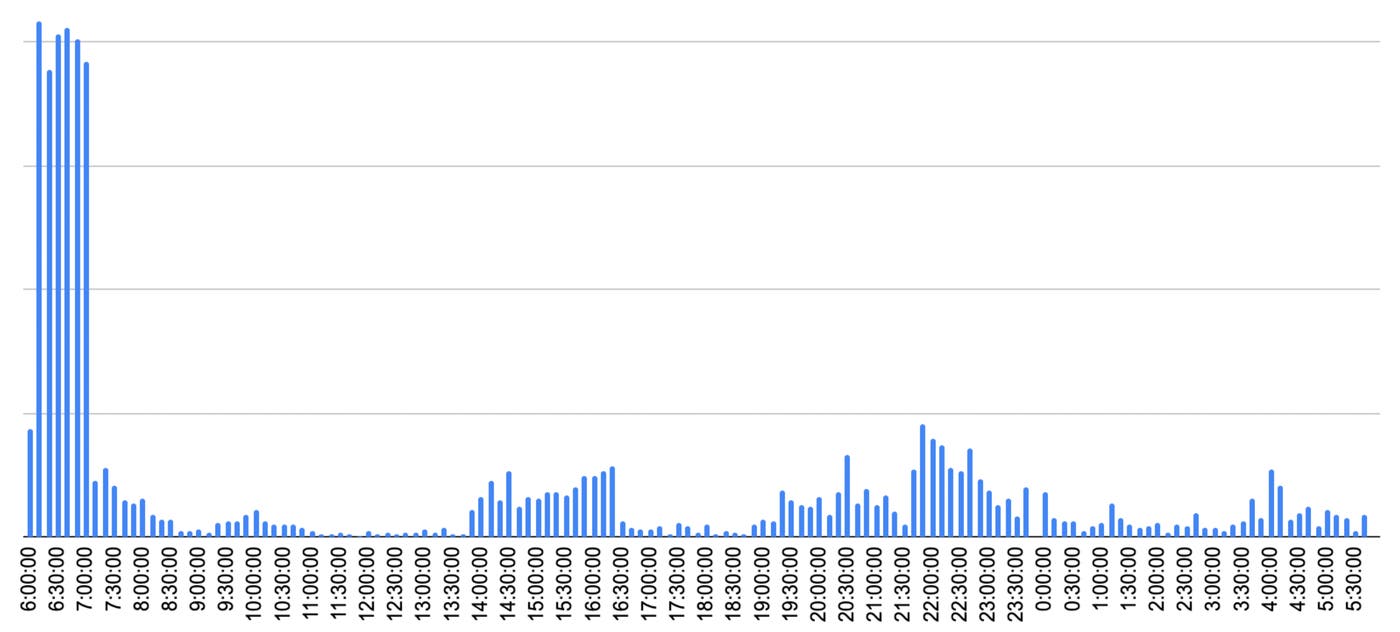
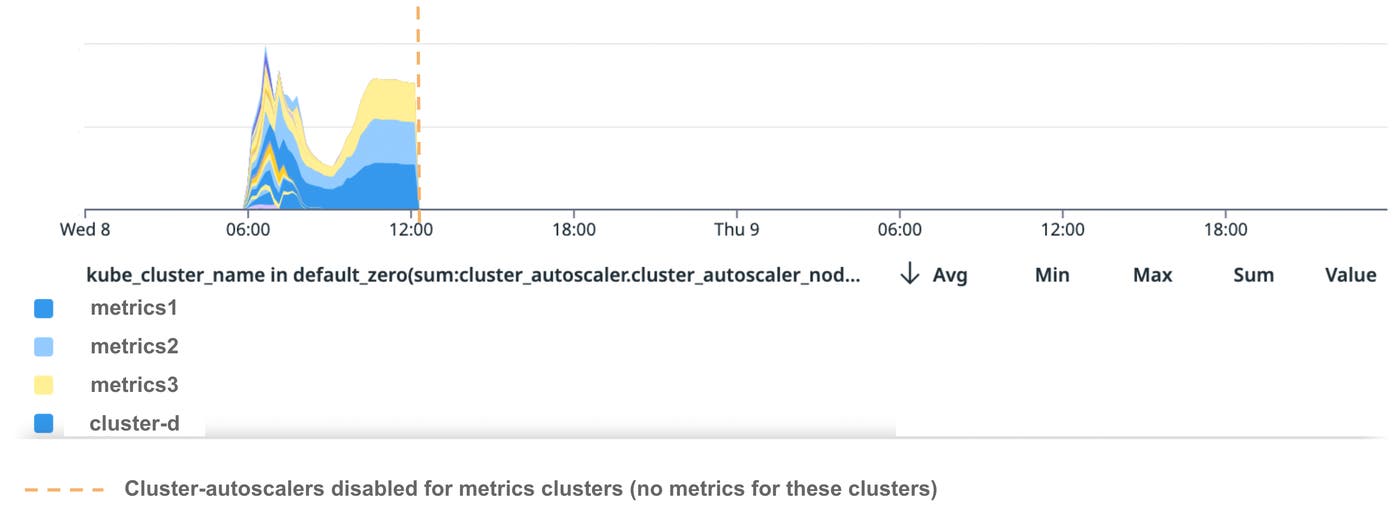
However, as we saw, it takes some time for nodes to become usable once they are created. The following graph shows the number of nodes that the cluster-autoscaler saw as not in Ready state across US1. Note that the two gaps in data occurred when we disabled the cluster-autoscalers, and so they were not reporting metrics.
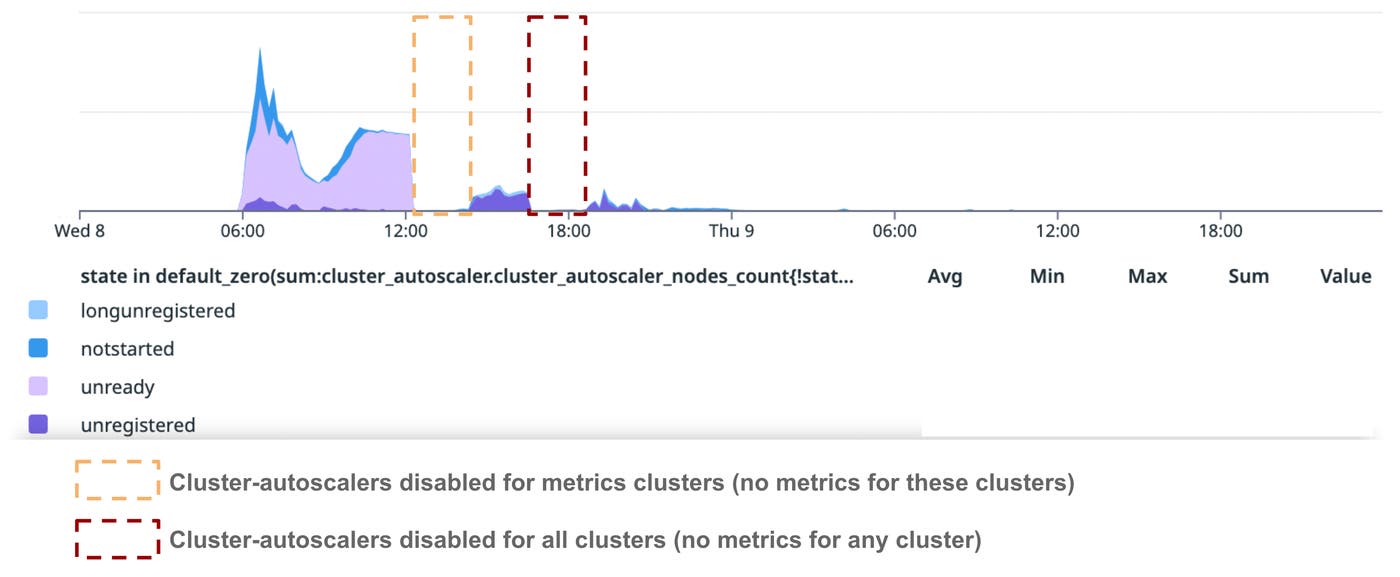
The states that are relevant to this incident are:
NotStarted: The cluster-autoscaler has asked the ASG to add a node, but the node has not been created yet.Unregistered: The cloud provider has created a node, but it has not joined a cluster yet. Nodes are in this state when they fail to get a certificate from Vault to register with the Kubernetes control plane.Unready: The node has joined the cluster but is notReadyyet. During this incident, this meant nodes had not reached theNetworkReadystate.
Unregistered nodes
Let’s focus on the timeline for Unregistered nodes first.
- 06:00–08:30 UTC: Thousands of nodes successfully transition through the
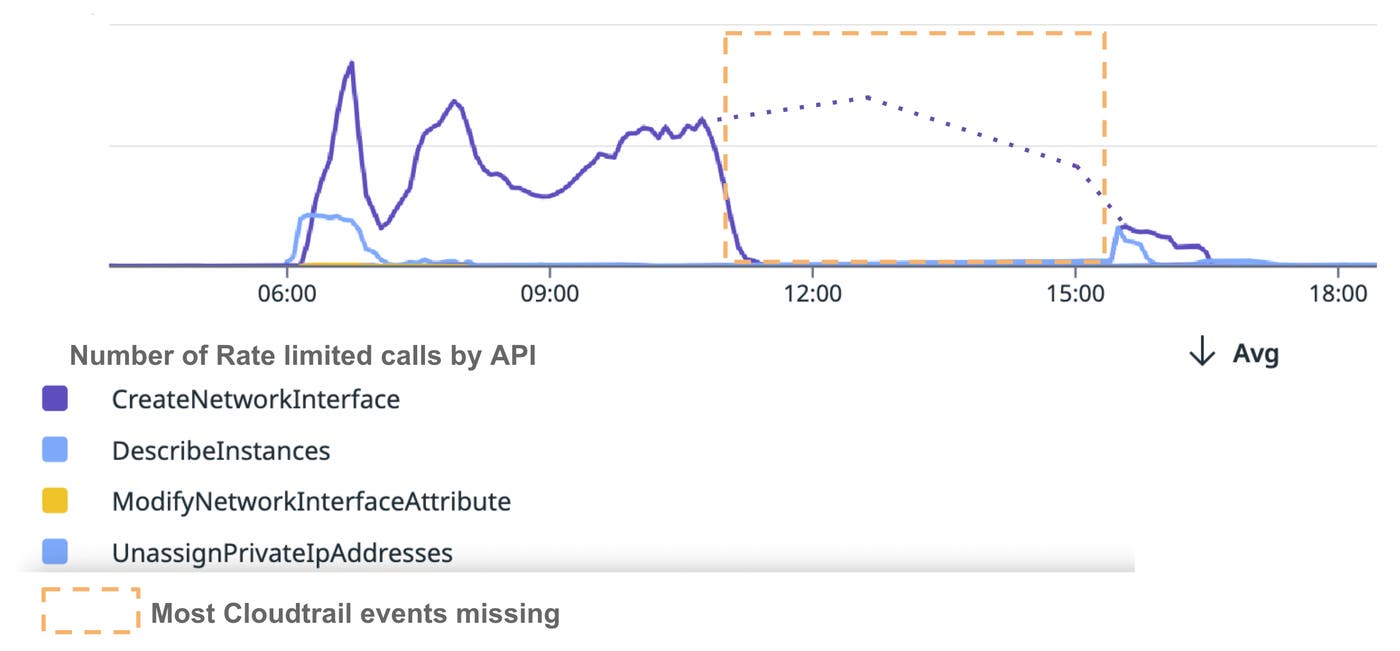
Unregisteredstate and join Kubernetes clusters. They take longer than usual to register because control planes are unstable and (mostly) because Vault is being rate limited on theec2:DescribeInstancescall due to the volume of instances being created and authenticating to Vault to get a TLS certificate. The following graph shows rate limiting by the AWS API (from CloudTrail events):
- 08:30 UTC: Almost all nodes have successfully registered with a cluster.
- 14:20–19:00 UTC: This marks a new phase when new nodes could not be registered (more on this later).
Unready nodes
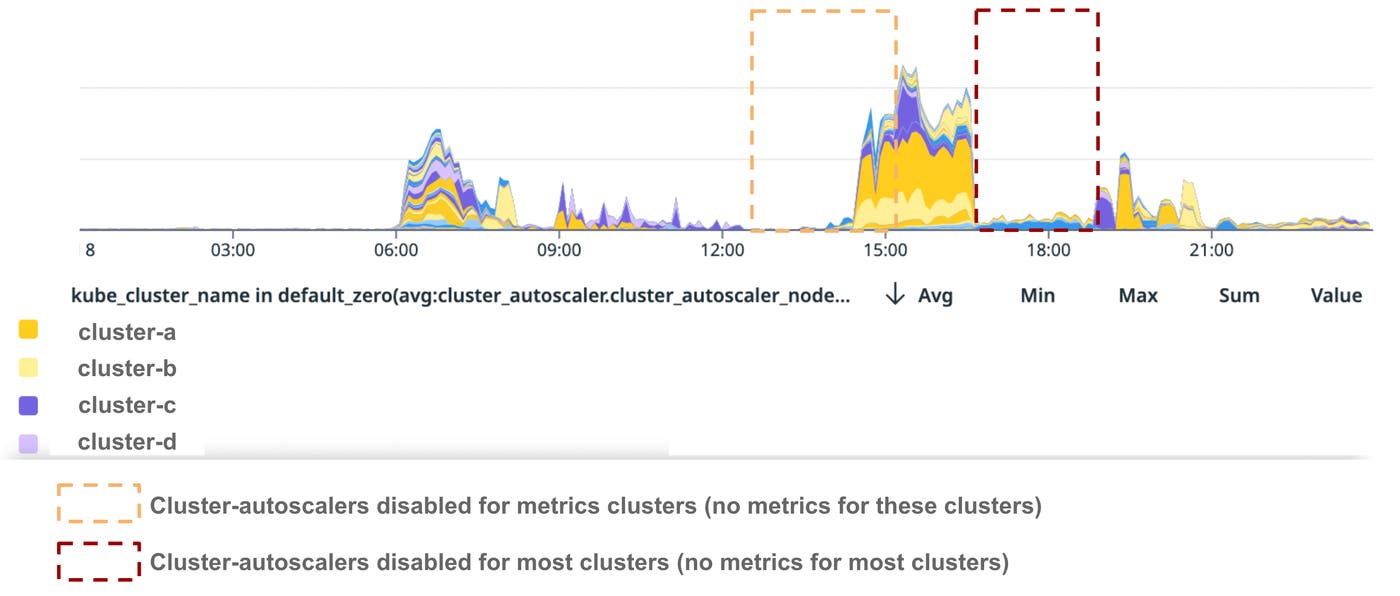
By 08:30 UTC, almost all nodes had successfully registered with a cluster. Some nodes were still transitioning through the Unregistered state when they were added by the cluster-autoscaler, but they were quickly joining clusters. However, if we look at the following graph, we see that we had many nodes in an Unready state. The graph illustrates the number of these nodes by cluster. Note that the graph cuts off at 12:20. We will explain why next.
This graph shows that many nodes went through the Unready state between 06:00 and 08:30 UTC, but after 08:30 UTC only three clusters—dedicated to the intake and processing of metrics—had nodes in that state. These clusters are significantly bigger than average: they each run more than 4,000 nodes. These clusters only run Ubuntu 22.04 nodes, and so most of them were impacted by the systemd security patch.
Because nodes in these clusters were not becoming Ready (or were doing so very slowly) and thousands of pods remained Pending, the cluster-autoscaler started adding new nodes at 09:00 UTC. The cluster-autoscaler kept adding nodes until we reached the maximum capacity for the three clusters (6,000 nodes per cluster). At this point, we had thousands of nodes in each cluster registered but not in Ready state.
Spot checking Unready nodes, we saw that they were not NetworkReady, indicating an issue with the Cilium Operator, which is responsible for adding network interfaces to nodes to provide network connectivity to pods. We looked at logs for the operator and saw it was failing to create interfaces because it was rate limited on the ec2:CreateNetworkInterface API call, as shown in the above graph “AWS API calls being rate limited.” The rate limits for this operation appear in purple on the graph. The graph shows the absolute number of calls being rate limited, but, in proportion, more than 99 percent of the calls were rate limited between 06:00 and 15:00 UTC. Part of the data is missing in the graph, but the dotted line completes the trend we observed. The reason this data is missing is that we faced capacity issues in our intake pipelines and decided to prioritize customer traffic over our own.
It would take us some time after the incident to fully understand why these three clusters were more impacted than the others, but the timeline of how we recovered these clusters is as follows (all times in UTC):
- 11:20: Determine nodes in these clusters are not becoming
Readybecause the Cilium Operator is rate limited. Start investigation. - 12:00: Create a ticket with AWS to increase the limit on the
ec2:CreateNetworkInterfaceAPI call. - 12:20: Disable cluster-autoscaler in these clusters to avoid creating new nodes. This explains why the above graph “Number of nodes in Unready state in US1 per cluster” goes to 0, as this metric is reported by the cluster-autoscaler.
- 12:30: Start deleting
Unreadynodes in one of the clusters to decrease pressure on AWS APIs. We quickly start doing the same with a second cluster. - 14:55: AWS confirms that they were able to significantly increase our API rate limits for
ec2:CreateNetworkInterface. - 15:00: We only have a few dozen
Unreadynodes in the first cluster and a few hundred in the second one (down from a few thousand). - 15:15: We consider these clusters recovered as we can successfully create network interfaces, and nodes are becoming
Ready. We re-enable cluster-autoscaler for both clusters.
After we had fully recovered compute capacity, we looked more closely at what had inhibited the recovery of these three clusters.
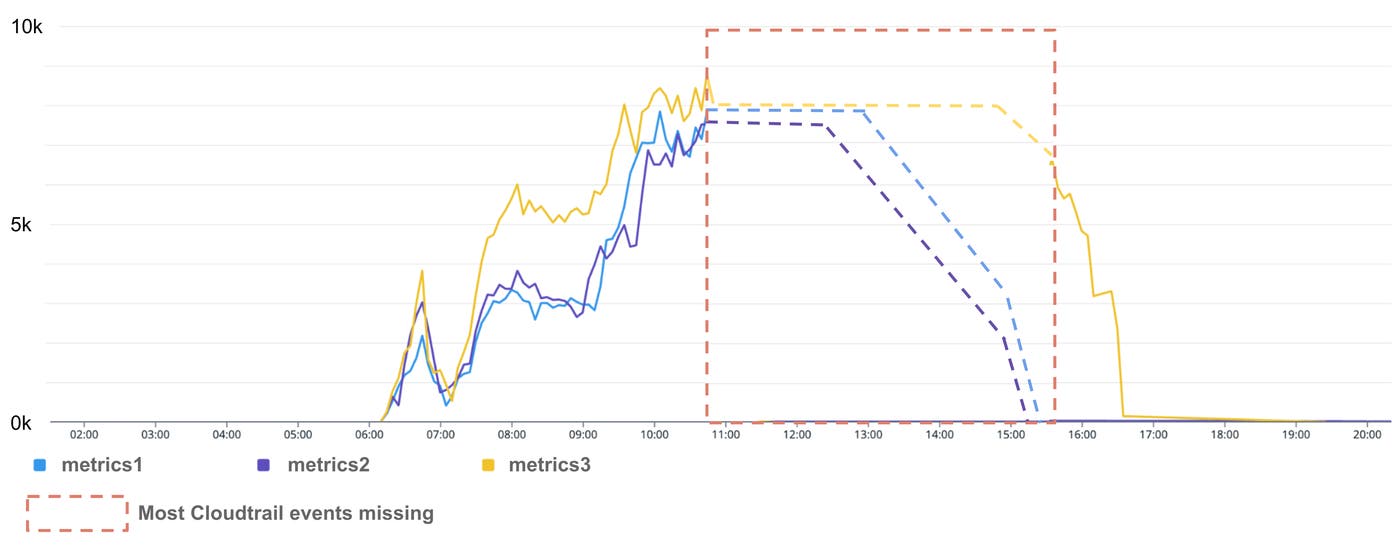
Because of the proportion of ec2:CreateNetworkInterface calls that had been rate limited, we knew that the problem lay somewhere in the Cilium Operator. We dove into the source code to understand better what was happening. The Operator has a reconciliation loop to make sure its local state and CRDs (CustomResourceDefinition representing CiliumNodes, or nodes as seen by Cilium) are in sync with the cloud provider. This reconciliation loop is triggered every minute, but it can also be triggered by specific events. When the trigger fires, the Operator goes through all nodes in the cluster and attempts to resolve IP deficit (during this incident, this meant adding network interfaces for new nodes). This is done by scheduling a method to be executed async via another trigger with a minimum interval of 10 ms. If the maintenance operation on any node fails, the on-demand top-level reconciliation loop is triggered, which in turn schedules more node level triggers. Each cluster runs a single (active) Cilium Operator, and this controller was trying to allocate an interface for every node during each reconciliation loop. The 10-ms minimum interval is too aggressive and resulted in severe rate limiting from AWS APIs. This issue was especially pronounced on clusters having the largest number of nodes requiring network interfaces.
The following graph shows the number of calls to ec2:CreateNetworkInterface performed by the Operator of each of the three clusters and illustrates them getting rate limited. Operators reached seven to eight thousand calls per minute, or about one call every 8 ms (slightly more frequently than the 10 ms limit because there is more than one trigger). We started the mitigation on the metrics2 cluster at 12:30 UTC, metrics1 at 13:00 UTC, and metrics3 at 15:00 UTC, when we saw that the first two clusters had recovered. We are missing many CloudTrail events for this period, but we can extrapolate based on our actions and recovery time.
The Cilium Operator has configurable settings that we use to limit the total number of API calls made to the cloud provider, so the aggressive 10 ms retries made little sense to us. We looked deeper and discovered a bug that resulted in the entire rate limiter logic being bypassed, which in turn made the AWS rate limiting more severe, slowing down our recovery. We worked with the Cilium team to fix the issue upstream. In addition, a commit was added upstream to implement exponential backoff for IP maintenance retries, but it was not backported to the version we were running.
Increasing cluster capacity
Returning to the day of the incident, by 15:15 UTC we considered the problem with metrics clusters to be resolved and all our clusters to have recovered. However, we soon discovered that we were facing another issue: Many applications needed to scale to process the backlog we had accumulated since the beginning of the incident, but they could not because new nodes were failing to join the clusters.
Starting at 14:30 UTC, newly created nodes remained in the Unregistered state because they could not get a certificate from Vault to register with the cluster control planes. This appears clearly on the graph showing the number of Unregistered nodes in US1. This was due to Vault becoming unstable because of a few compounding factors:
- The volume of queries spiked as we significantly scaled up to process the backlog.
- Queries were taking longer to complete as we were rate limited by the AWS API.
- The problem was made worse by this issue, which has since been patched.
Here is a basic timeline of the Vault impact (all times are in UTC):
- 14:30: Vault AWS login latency spiked because we were rate limited when using the AWS API to validate instance credentials. Instances started failing to register because they couldn’t get signed certificates from Vault.
- 15:30: We opened an AWS support case to raise our
ec2:DescribeInstancesrate limit. - 16:31: We disabled auto-scaling of Kubernetes nodes across all of US1 to prevent the creation of new nodes and decrease load on Vault. As a side effect, we lost the cluster-autoscaler metrics, which explains why the number of
Unregisterednodes falls to 0 at 16:30 in the “Number of Unregistered nodes in US1” graph. - 17:30: AWS increased our
ec2:DescribeInstancesrate limit. - 18:22: We implemented rate limits to protect Vault nodes and set them to 20 max concurrent requests.
- 18:30: Vault stabilized, shedding 20 to 60 percent of requests.
- 18:34–19:00: We progressively increased Vault rate limits.
- 19:00: Client impact ended. Vault was no longer shedding excess requests. We progressively re-enabled cluster-autoscaler in all clusters in US1. We can see node creations were triggered by the cluster-autoscaler because we saw a significant increase in pending pods, as illustrated in the following graph.
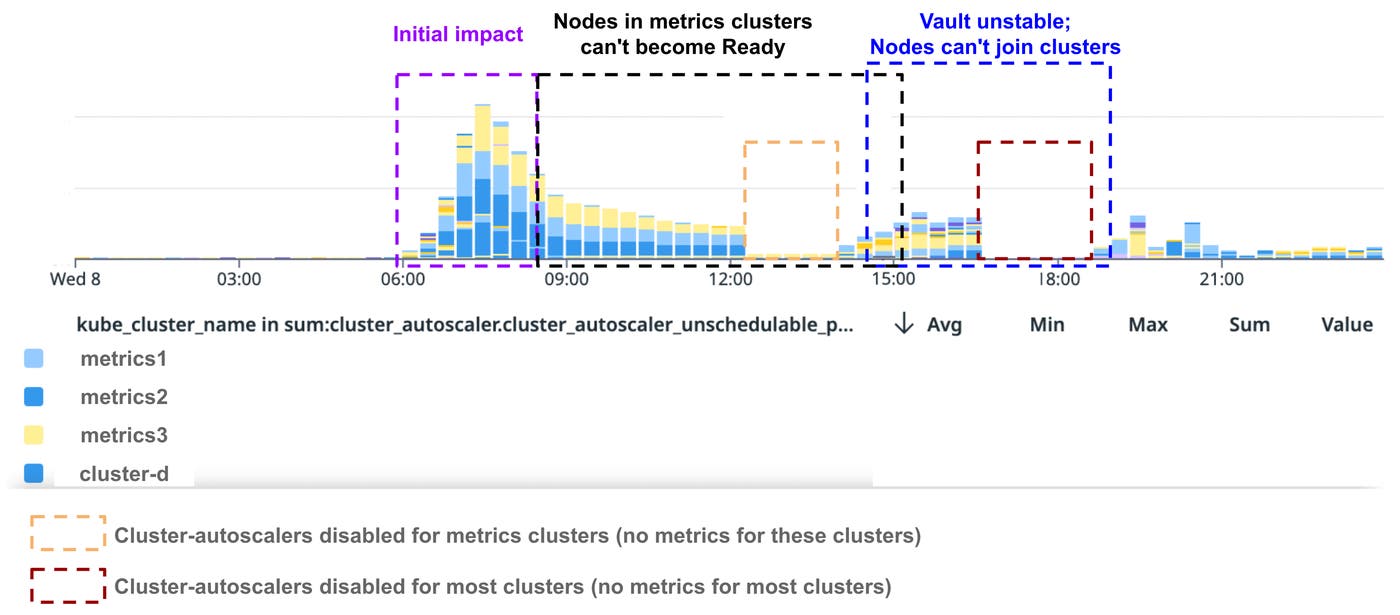
The number of pending pods started increasing after 14:00 as teams were scaling up their deployments to process the accumulated backlog. The cluster-autoscaler created nodes for these pods, but they could not join clusters and remained Unregistered as shown in the graph of Unregistered nodes in US1.
Timeline of the recovery of US1 compute capacity
We can summarize the recovery of compute capacity in US1 with this timeline (all times in UTC):
- 06:00–08:30: After initial impact, it takes us some time to recover capacity, but by 08:30 we are mostly OK except for three clusters ingesting metrics data.
- 08:30–15:00: Three metrics clusters are missing significant capacity and have many pending pods as new nodes can’t become
NetworkReady(i.e., they can’t get IP addresses for pods). - 14:30–19:00: We can’t register new nodes because Vault is unstable.
- 19:00 onward: Vault is stable again and we can create new nodes.
A good illustrative summary of the impact is the number of unschedulable pods in the above graph “Number of pending pods in US1 per cluster.” The key phases that this graph shows are (all timestamps in UTC):
- 06:00–08:30: Many pods across all clusters are unschedulable.
- 08:30–15:00: Pods in metrics clusters are unavailable.
- 14:30–19:00: Pods are unavailable across all clusters as we’ve scaled out to manage the backlog. The cluster-autoscaler creates new nodes, but they can’t join clusters because Vault is unstable and can’t sign certificates.
- 19:00: The number of unavailable pods slowly decreases as we can create nodes again. If we look again at our graph of CloudTrail data measuring the number of instances created in US1, we can observe this timeline:

Key takeaways from a platform perspective
We had never faced an incident of this magnitude: It impacted all our data centers at the same time and more than 60 percent of our instances. We learned many lessons the hard way:
- Running isolated regions on different cloud providers was not enough to guarantee against a global correlated failure. For example, despite this isolation, our instances still use the same operating system, the same container runtime, and the same container orchestrator. We will continue to make sure our regions are strongly isolated, but will now prepare for global failure scenarios.
- We frequently test that we can scale our infrastructure fast and make sure we have headroom for a sudden 50-percent increase in compute capacity needs for any application. However, we had never prepared for workloads requiring 100-percent capacity increase, or tested to add thousands of instances over very short periods of time. During this incident, we pushed all our systems beyond everything we had ever done and discovered limits, edge-cases, and bugs we did not know about. In the future, we plan to test better for such scenarios.
- Building strong relationships with partners—cloud providers, but also open source communities—is very important during and after such events. For instance, when we reached out to our cloud providers during the incident, they went out of their way to help us and increased many limits very fast. After the incident, we had many constructive discussions about options and potential improvements with the engineering teams of these partners. Of note, a few days after the incident, the Cilium team had made sure that the IP rules configured by Cilium could not be removed by systemd.
Conclusion
From the start of this outage, our engineering teams worked for approximately 13 hours to do what they had never had to do before: restore the majority of our compute capacity across all of our regions. Along the way, we ran into multiple roadblocks, hit limits we had never encountered, learned the lessons mentioned above, and ultimately grew as an organization.
Even after we had successfully restored our platform-level capabilities, we knew that it was only the first step on the road to complete recovery. The next leg was to restore the Datadog application. We’ll detail our efforts in the next post in this series.

