

From smart thermostats and grocery store checkouts to public utility infrastructures and industrial manufacturing lines, the Internet of Things (IoT) is all around us—and growing larger every day. But with this rapid growth comes a number of operational challenges: IoT devices collect a large amount of data, and are often distributed across harsh, ever-changing environments. When running IoT infrastructures at high scale, monitoring device fleets that consist of multiple hardware models, processing architectures, networking configurations, and operating systems becomes an increasingly complex task.
Today, we’re excited to announce the release of a Datadog Agent designed for IoT devices and embedded applications. The IoT Agent is a lightweight version of the standard Datadog Agent that takes up fewer resources while still providing full visibility into your devices by automatically collecting over 100 health metrics and application logs. Using the IoT Agent, you can monitor all of your IoT devices within a single, unified platform, helping you optimize performance, rapidly resolve issues, and improve customer satisfaction.
All the things, all the time
To meet the demands of diverse industries and use cases, the Datadog IoT Agent can be installed on the most popular IoT operating systems and hardware architectures (including x86 and Armv7/v8 processors) with a single command. Once you’ve installed the Agent, you can analyze the metrics it collects, set up alerts, and use your findings to address any issues discovered. And by adding tags to your devices and metrics based on categories like location and device version, you can easily sort your fleet to view and compare the performances of the devices you want to focus on.
Complete visibility into your IoT network
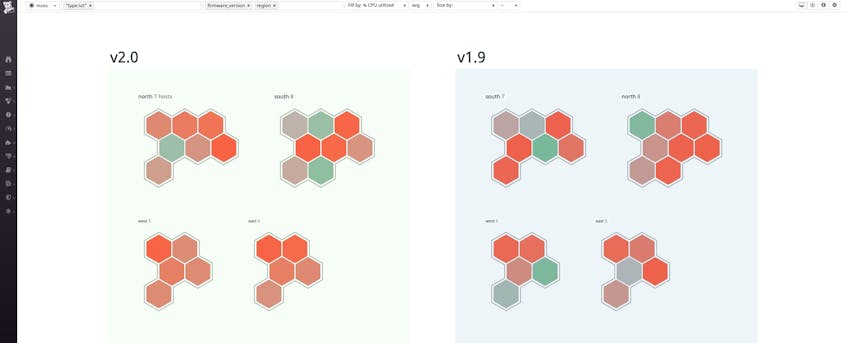
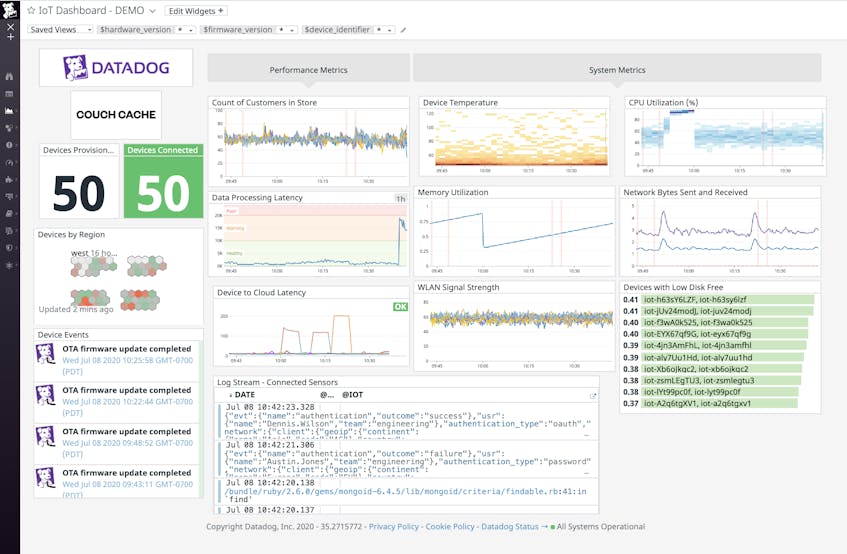
When managing an IoT device fleet, it’s imperative that operators can easily monitor the information that is most relevant to their use case. With Datadog, you can create custom dashboards that display essential metrics—such as network throughput, disk usage, and more—across your entire device fleet so that you can see at a glance the state of your IoT infrastructure. For instance, in a retail setting, you might want to monitor all of the points of service in a large department store: with a few clicks, you can track those devices from a single dashboard. Then, you can use tags to filter your graphs and drill down to specific groups or even individual devices.
You can also define and collect custom metrics, letting you visualize and alert on the key data that is most important to your IoT fleet. For example, when monitoring retail points of service, you can collect metrics on transaction time, number of failed transactions, and more.
Like the standard Datadog Agent, the IoT Agent collects logs from all of your devices so that you can dive deep into a faulty device’s performance as soon as a problem is caught. Datadog’s Log Explorer provides a centralized view from which to troubleshoot device performance. You can easily filter and analyze all of your logs in real time, so that finding the logs that you need to fix your issue is a seamless process.
Connecting the dots
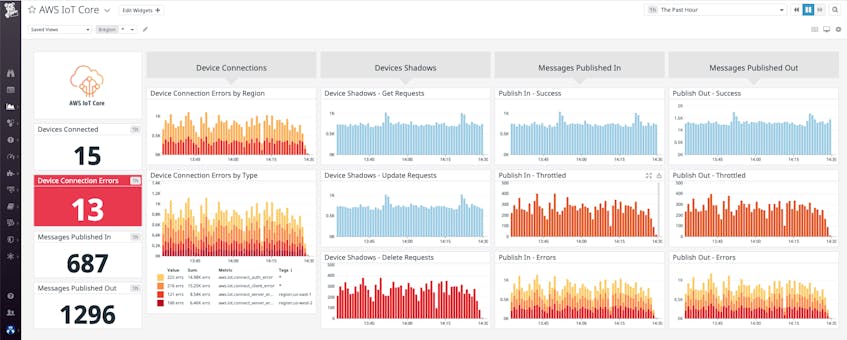
A dynamic IoT system might consist of numerous devices, a device management system, stream processing applications, and multiple datastores—all of which produce a dizzying number of health metrics. To simplify things, Datadog integrates with technologies at every level of your stack. This lets you monitor your IoT devices, management services (such as AWS IoT Core and Microsoft Azure IoT Hub), and backend services simultaneously. This way, you can quickly determine if an issue is caused by malfunctioning devices, connection issues between devices and the cloud, or performance of backend services.
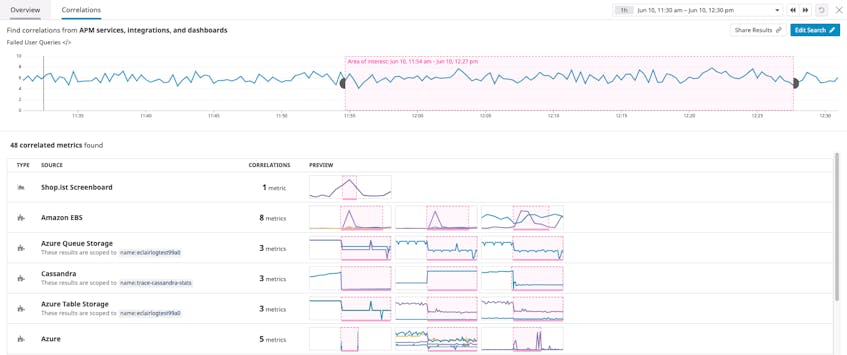
Once you’ve discovered an anomaly in your metrics, you can use Datadog’s machine learning-based Metrics Correlations to analyze a particular timeframe of data and automatically surface possible issues between the faulty host and any related upstream or downstream services that might be affecting its performance.
Never miss a Thing
IoT technology enables powerful solutions across a variety of industries. But, because these solutions contain so many interlinked parts, micro-level problems can easily propagate through your system and become macro-level failures if not identified quickly. With Datadog, you can easily set up alerts on any of your business metrics and trigger warnings before an outage occurs or a service level objective (SLO) fails. And, for even greater coverage, Watchdog, Datadog’s automatic anomaly detection tool, tracks services and metrics across your entire infrastructure and alerts you to problems without any configuration required.
Join the fleet
With the Datadog IoT Agent, you can seamlessly monitor all of your IoT devices from a single dashboard. And with over 700 other technology integrations supported, it’s never been easier to gain visibility into your entire IoT system. If you’re not already using Datadog, get started with a free 14-day trial.
