

When you’re operating databases at scale, being able to get real-time insights across all your databases is essential for addressing issues and identifying areas for optimization. Datadog Database Monitoring’s Database List allows you to monitor your entire database fleet in one place, so you can quickly identify and troubleshoot overloaded hosts and gauge the impact of problematic queries throughout your infrastructure. With active connection information, you can easily analyze the specific queries affecting database performance. Additionally, in-depth wait event analysis enables you to understand where queries are spending most of their time—and investigate slowdowns by correlating changes in query performance with infrastructure metrics, logs, and database telemetry.
In this post, we’ll explore how our Database List can help you:
- Identify and troubleshoot overloaded databases
- Investigate performance issues with detailed query metrics
Identify and troubleshoot overloaded databases
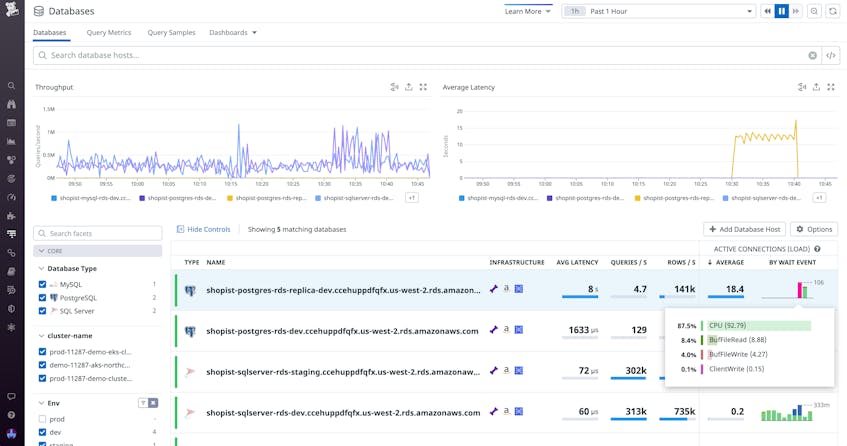
The Database List provides a high-level overview of all your databases, regardless of the type of engine they’re running or where they’re deployed. You can sort the list based on key metrics, such as average latency, database load, and throughput, to pinpoint any databases experiencing issues. The list also allows you to filter your databases by source (e.g., MySQL, PostgreSQL, or SQL Server) as well as by team, cluster, and other custom tags.
The list includes active connections, which show you where your query workload is distributed in near real time. You can view a breakdown of connections by wait event, allowing you to evaluate what’s slowing down your servers. This also enables you to quickly determine whether an issue is caused by a query, misconfiguration, or other problem with your infrastructure.
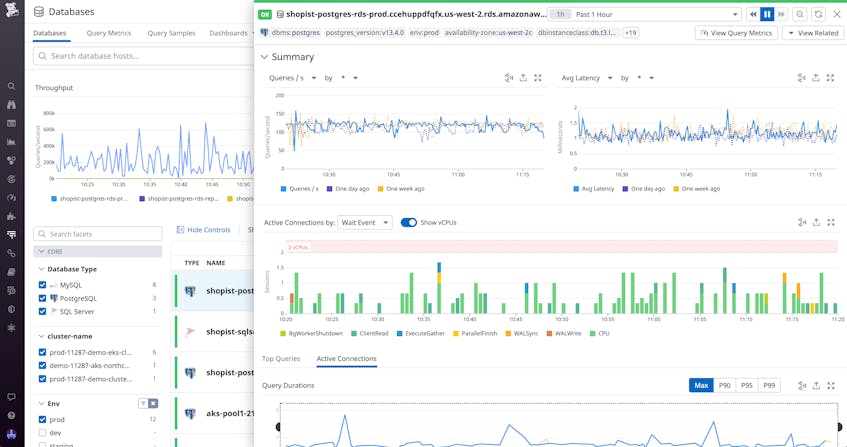
For example, if you notice high latency and a high number of CPU wait events on one of your databases, you can click on the database to investigate further. You can then view the Instance Details panel (shown below), which displays a timeseries graph of these wait events that includes a threshold for the maximum number of vCPUs that are available. In this case, you can see that there are more events waiting for processing than there are cores available to run them. This indicates that you may be artificially bottlenecking yourself by running a large workload on undersized instances.
To investigate if this is a temporary bottleneck or a longer-term issue that needs to be addressed, you can pivot to the instance dashboard to see whether this host is often overloaded. If so, you may want to take steps to prevent future issues, such as scaling up your infrastructure or optimizing your code.
Investigate performance issues with detailed query metrics
The Instance Details panel helps you visualize in-depth SQL metrics from each instance in your database fleet, including the top queries, how many users are currently executing them, and how long they are taking to execute. You can see this data displayed side by side with other database metrics, such as queries per second and average query latency, to help you connect performance issues to the problematic queries that caused them. If you want to investigate whether a query is bringing your hosts to a halt, for example, you can click on the statement to dive into query details.
The panel also allows you to explore a detailed breakdown of active sessions. This includes a graph of query durations that can be filtered by maximum or percentile values, enabling you to track performance over time. You’ll also see a list of in-flight queries with detailed session information, including the process ID and associated user.
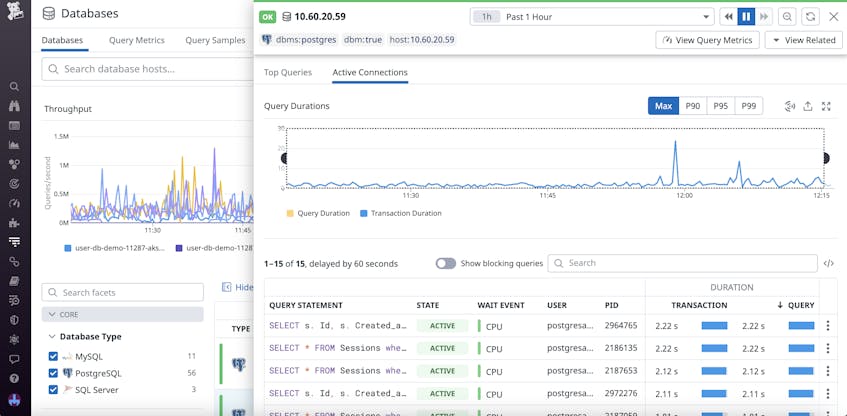
To stay on top of issues, you can set up monitors to automatically alert you when queries on any individual database instance exceed a certain time limit, such as five minutes. If you receive a notification, you can view the Instance Details panel and analyze a list of all your currently running queries to evaluate the impact on any related processes. You can then investigate further by clicking on any problematic queries to view additional resource information in the Query Details panel. For example, if you determine that a query is waiting on a lock, you can kill the blocking session to free up processing and analyze the query details for future optimization.
Get started with the Datadog Database List today
With the Database List, you can explore the health of all your databases, decide whether to scale your infrastructure, and drill down into query metrics to quickly troubleshoot issues. Active connection information allows you to analyze where your workload is distributed and how efficiently it’s being handled, and wait event analysis helps you understand where queries are spending most of their time.
If you’re already using Datadog, see our documentation to learn how to get started with Database Monitoring. Or, if you’re new to Datadog, you can sign up for a 14-day free trial.
