

Datadog Data Streams Monitoring (DSM) provides detailed visibility into your event-driven applications and streaming data pipelines, letting you easily track and improve performance. We’ve covered DSM for Kafka and RabbitMQ users previously on our blog. In this post, we’ll guide you through using DSM to monitor applications built with Amazon Simple Queue Service (SQS).
As a fully managed message queuing service, SQS helps ensure a highly reliable flow of messages between components through asynchronous processing. It can also increase the overall fault tolerance of your systems and applications by helping you decouple their components in order to prevent cascading failures.
In this post, we’ll show you how you can use DSM for SQS to gain critical visibility into your event-driven applications and track their performance by analyzing message throughput as well as end-to-end latency.
Gain critical visibility into your event-driven applications
DSM provides deep visibility into every component of your application so you can detect, pinpoint, and troubleshoot slowdowns and bottlenecks. The DSM topology map visualizes all of your pipeline components and their dependencies, including every service and queue, from end to end.
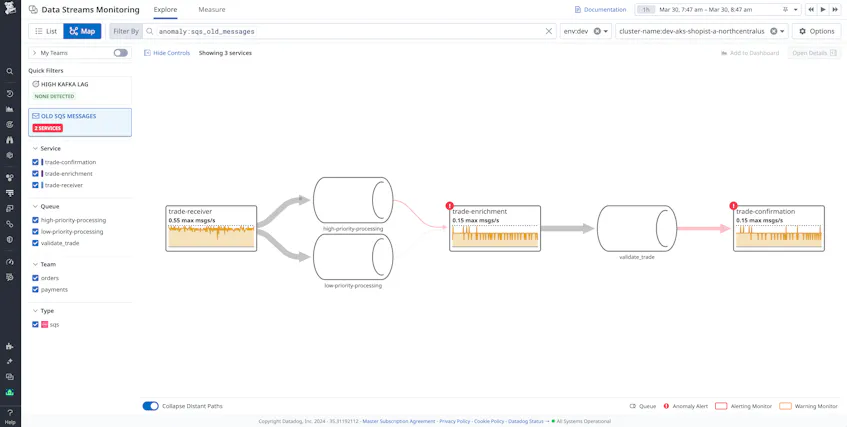
The DSM map shows throughput for each service as well as the time messages spend in your queues, clearly highlighting issues such as slow-performing services.

You can select any service or queue from the map to open a side panel of key health and performance metrics—which can help you troubleshoot issues such as abnormal throughput and suboptimal latency—as well as ownership information drawn from the Datadog Service Catalog, so you can easily coordinate with other teams.
Once you’ve installed Datadog’s SQS integration, you’ll have access to a range of supplementary SQS-specific metrics within DSM. You can access them by selecting any SQS queue from the DSM topology map.

By configuring monitors to alert on these metrics if and when they breach expected limits, you can ensure a timely response to performance issues in your event-driven applications. (You can find our recommended monitors for SQS here.)
Important SQS metrics to monitor include:
- Age of oldest message and number of messages delayed. These metrics can help you identify stale messages, suboptimal performance, and slowdowns in your application. A spike in either of these metrics can point you to issues such as bottlenecks.
- Number of messages deleted, sent, and received. Comparing these metrics can bring to light a range of potential and ongoing performance issues. For example, if the number of messages sent is greater than the number of messages deleted (i.e., removed from the queue after having been retrieved), you may have a buildup of unprocessed messages in your queue. On the other hand, if the number of messages deleted is greater than the number of messages sent, there may be multiple consumers attached to one queue, which could cause issues downstream. Or, if the number of messages received is significantly greater than the number of messages sent, your application may be attempting to process the same messages repeatedly.
- Sent message size. You can track this metric to catch and prevent errors and ensure that the volume of data flowing through your application is as expected. SQS only allows messages between 1 byte and 256 KiB in size. Messages exceeding the upper limit will trigger 413 (Request Entity Too Large) errors. Unexpectedly large or small messages may also indicate incorrect routing of messages in your application.
All of these metrics can help guide your troubleshooting and optimization efforts. Next, we’ll look at other ways DSM can help you track throughput and latency so you can optimize the performance of your event-driven application and meet your SLAs.
Ensure the health of your event-driven applications by tracking throughput
With DSM, you can ensure that message throughput never overwhelms your event-driven application by tracking the volume of data flowing from each upstream (producing) service to each downstream (consuming) service in terms of both rate (messages per second) and size (bytes per second). By using these metrics to proactively identify any type of unexpected change in throughput, you can catch upstream performance issues and stay one step ahead of potentially disruptive impact on your downstream services.
Configuring monitors on these metrics can help you catch these changes in throughput and preserve the health of your application. For example, a significant increase in the volume of messages flowing through your SQS queues can be an important indicator that you need to scale up downstream services in order to ensure that they can accommodate the increased volume of data. A significant decrease may be a sign of a bottleneck or other issues upstream. DSM makes these and other common issues easy to catch with its out-of-the-box recommended monitors.

Let’s say one of your monitors alerts you to a steep dropoff in the incoming throughput to one of your consumer services. You can select any upstream service via the DSM map to access its Throughput Summary. This summary provides a breakdown of key data on each upstream producer and downstream consumer service, including throughput and service ownership information, so you can quickly coordinate with service owners on the next steps toward resolution.

Next, we’ll look at how DSM provides a holistic, end-to-end view of the performance of your streaming data pipelines.
Measure the end-to-end latency of your streaming data pipelines
Datadog DSM enables you to measure end-to-end latency between any two services in your event-driven architecture. This lets you analyze the time it takes for messages to traverse your pipelines, allowing you to compare latencies when multiple producers or consumers are involved in one pathway.
Under the Measure tab in DSM, you can select the start and end services for your latency measurement from the DSM map or dropdown selector.
Once you’ve selected a pair of services for your measurement, DSM will show you latency metrics between those two endpoints. DSM also allows you to quickly create monitors on the latency between these services, helping you stay alert to suboptimal performance or slowdowns in your pipelines and pinpoint the sources of these issues. For example, if a monitor alerts on an increase in end-to-end p95 latency in a critical pipeline, you may want to evaluate your configurations and increase batch size to balance throughput and latency.
By providing end-to-end latency metrics, DSM can help you ensure that you are meeting your SLAs and determine where to focus your optimization efforts.
Expand your visibility into event-driven applications that use SQS
Whether you’re using Amazon SQS, Kafka, or RabbitMQ, Datadog DSM allows you to easily monitor and improve the health and performance of your event-driven applications and streaming data pipelines. To get started, you can check out our other blog posts on DSM and its integration with Datadog APM, as well as our docs. Readers of this post may also want to check out our SQS integration docs. If you’re new to Datadog, you can sign up for a 14-day free trial.
