

Migrating your on-prem infrastructure to the cloud offers a host of benefits, including scalability, mobility, security, and cost reduction. When it comes to cloud network monitoring, tracking the availability and performance of the cloud services your applications rely on becomes even more important. However, moving from self-managed infrastructure to third party–managed services introduces a number of challenges.
Cloud environments are inherently ephemeral, with the IPs of your hosts and other service endpoints rapidly changing as your infrastructure scales up and down to meet demand. This can make it difficult to get clear visibility into what is happening at the infrastructure level, and even more so at the application level. Furthermore, with common methods for monitoring cloud network data (for example with VPC flow logs or proprietary monitoring tools like Amazon CloudWatch) it may be difficult to get insights across all of the services at work in your environment. And, cloud-native tools do not enable you to track data flow across data centers and multiple providers, which is key when monitoring hybrid or multi-cloud infrastructure.
Datadog Network Performance Monitoring lets you track network communication across your entire cloud environment, giving you deep visibility into traffic flows alongside key telemetry from your services and underlying infrastructure to help you identify and diagnose issues. In this post, we’ll show you how Datadog NPM can help you:
- determine if a problem with your application is the result of a cloud network outage
- visualize and monitor live network traffic across your native infrastructure and cloud services
- optimize your cloud traffic-related costs
Detect a cloud network outage
Network outages are a common point of failure in any cloud-hosted environment, and detecting an outage quickly is critical to minimizing its impact on your customers. Rather than waiting on a cloud provider to update their status page, you can use NPM to investigate correlated network metrics, client-side request traces, processes, and logs. This helps you quickly rule out issues on your end and identify when a cloud provider outage is responsible for your services’ degraded performance.
Let’s say you receive an alert about spikes in errors and request latency for a subset of your application’s services. If the triggered alert seems to be scoped to a particular region or availability zone, it could indicate that a cloud provider network outage is the cause. In order to determine if this is the case, you can use Datadog NPM to rule out other possible explanations. Let’s first determine:
- Is the problem with your local network (e.g., traffic from one service overloading the underlying infrastructure of its dependencies, or DNS failure)?
- Is it a problem with an individual service (such as an error in code, or resource saturation of its underlying infrastructure)?
Use NPM to identify networking issues
One possible cause of service latency is too much traffic being sent to a destination endpoint, to the extent that the endpoint cannot keep up with all of its inbound requests.
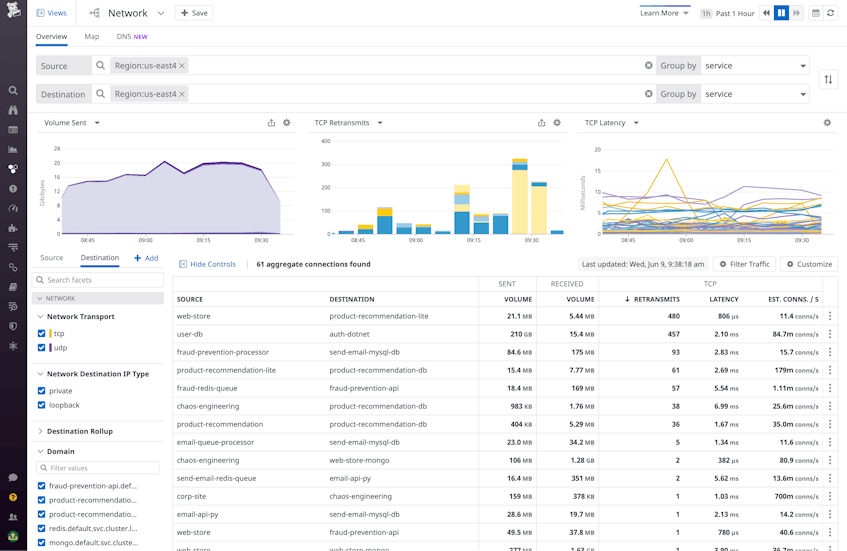
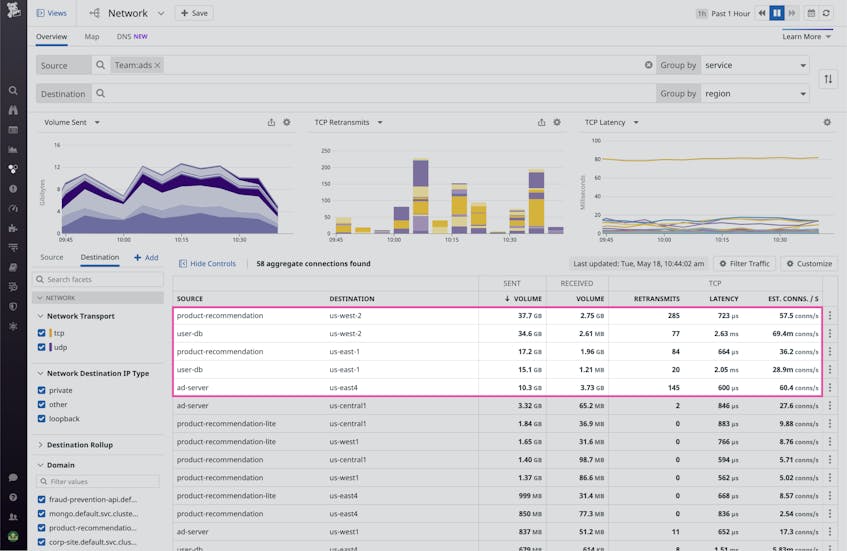
To investigate the cause of service latency in the Network view, you can aggregate traffic by service and then filter to the cloud region you’ve been alerted to. This shows you all the service-to-service dependency paths between services in that region. Sorting the dependency table by retransmits or latency, you can see which connections are experiencing the most degraded performance. If, for example, you observe an unexpectedly high rate of TCP established connections correlated with spikes in TCP retransmits and latency, you can hypothesize that the source is overloading the destination’s underlying infrastructure with requests.
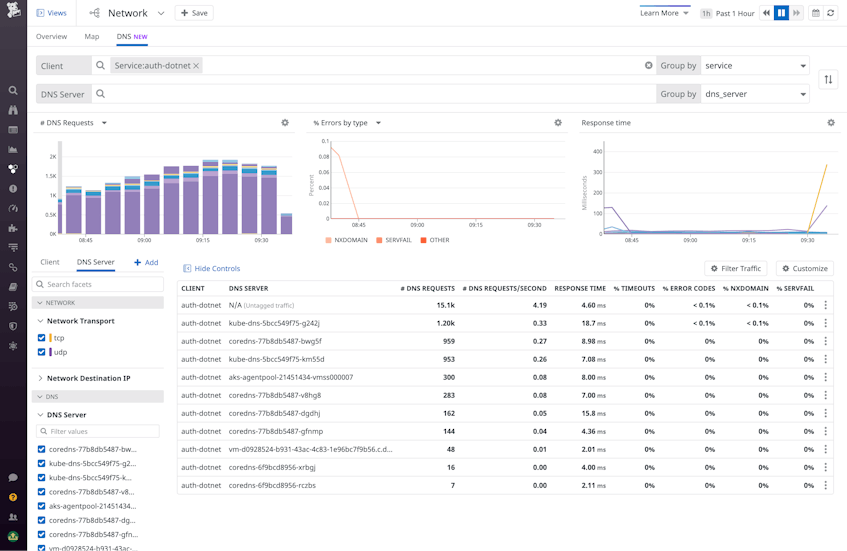
Next, you should determine the cause for the rise in TCP connections, which could result from a number of underlying issues, including application errors—such as the source service being configured to send a high number of unnecessary or invalid requests. But if you don’t see a spike in traffic volume corresponding to the observed increase in retransmits and latency, it could be that a DNS failure is at play. For example, if your client service relies on data from an AWS dependency (e.g., records from RDS) in order to communicate with the destination service, and it can’t fetch this data due to poor Route 53 performance, its communication with the destination will slow down. In the DNS tab of the Network view, you can investigate DNS requests from any client in your infrastructure to Route 53 IPs. This allows you to identify DNS issues that may be leading to dropped requests and latency at the DNS level, resulting in a drop in traffic volume or increased round-trip time for a dependency.
If your network paths between services appear healthy, it’s time to look for service-level issues. Next, we’ll look at how you can correlate network data with telemetry from other layers of your environment to see if the problem could be coming from your application itself or the underlying infrastructure.
Use APM, logs, and infrastructure metrics with NPM to spot service-level issues
Datadog NPM pulls together relevant distributed traces, logs, and infrastructure-level data within the same view that you can use to spot issues on the source or destination network endpoint.
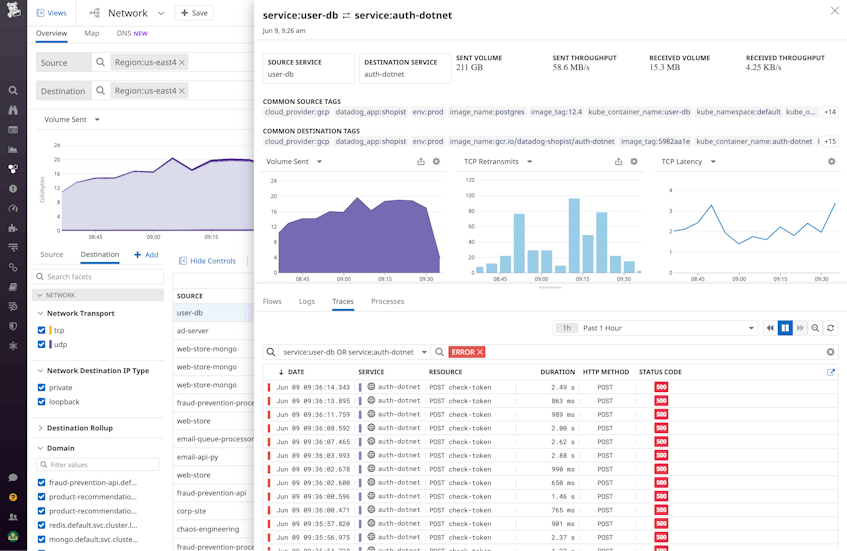
The Traces tab surfaces distributed traces from requests that propagate across the source and destination endpoints, allowing you to drill down and see exactly where application-level errors are occuring. For example, if you’re observing an unusually high request volume from the source endpoint that is resulting in increased latency and retransmits, examining relevant traces might reveal a function on the source endpoint with a faulty loop generating a large number of open connections unnecessarily, leading to downstream issues with the service’s dependencies. You can check this in the Network view by adding the “TCP established connections” metric to the table.
Next, you can use the Processes tab to view the performance of processes running on your source and destination endpoints. This lets you quickly see whether certain heavy processes are causing resource exhaustion, straining software performance, and ultimately leading to increased request latency.

If none of these steps reveals the root cause of your application’s request latency, you can surmise that a cloud provider outage may be the culprit.
Monitor the performance of your cloud service dependencies
When running applications in the cloud, it is difficult to piece together telemetry about all the managed services you rely on and see the full picture. Datadog NPM’s cloud service autodetection automatically detects the AWS services within your network. This enables you to easily observe network communication between your internal and cloud-managed services, spot slow dependencies, and correlate network data with cloud provider performance signals using a single pane of glass in the Network view. This helps you distinguish between internal application issues from misconfigured third-party services or cloud provider outages.
Visualize traffic across S3, RDS, and other cloud services
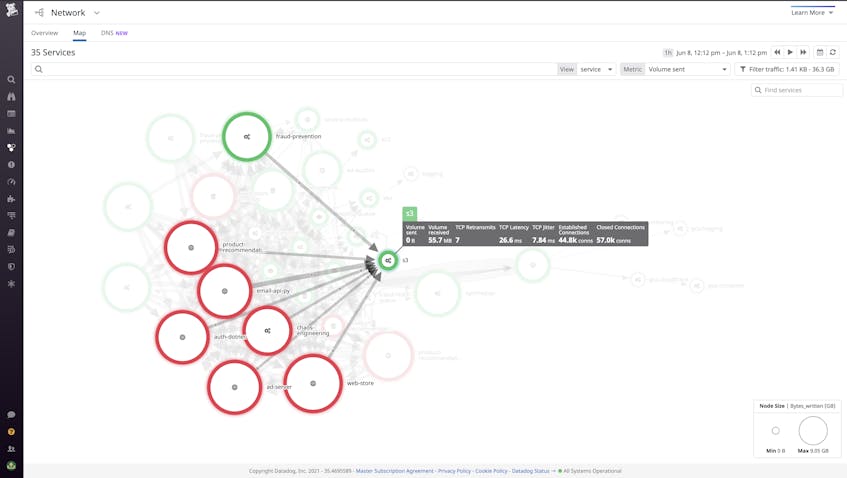
Let’s say you have several Amazon S3 buckets that store web traffic and UX datasets captured at your frontend. Using the Network Map, you can visualize the performance of your S3 dependencies to validate that records are being sent to buckets efficiently and that data is successfully retrieved from S3. Setting the edge thickness to represent TCP retransmits or latency makes issues easy to spot by displaying thick edges. Services that trigger alerts and errors are highlighted on the map in yellow and red, respectively, giving you a birds-eye view of all components that may require investigation. With this feature, you can monitor the traffic between S3 and its dependencies, looking out for increased latency and retransmits.
Conversely, you can use the Network view to show all the clients communicating to this S3 service, helping to surface unexpected network pairings. NPM automatically tags subcomponents of several key AWS services, including S3 buckets. You can filter traffic by S3 bucket to spot network issues localized to a particular bucket that may suggest, for example, a regional performance issue where that bucket is located.
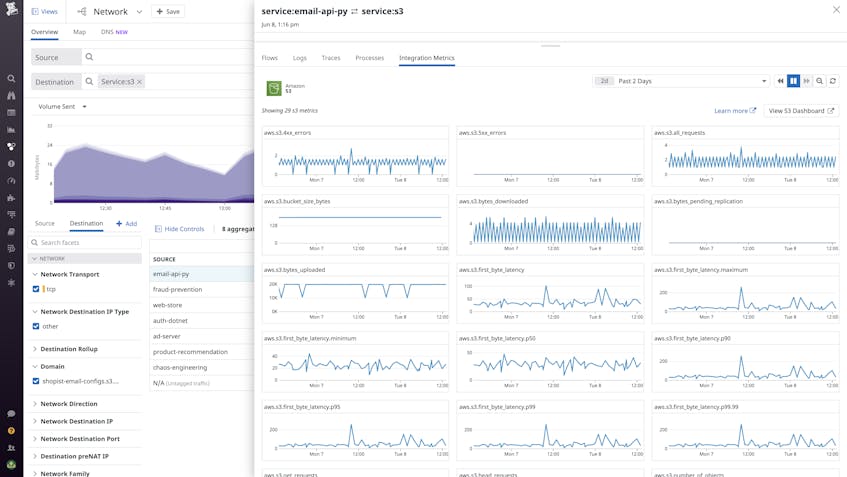
Then, you can investigate an S3 dependency in the Network view side panel to examine key health and performance indicators for the S3 service alongside traces, logs, and other data. Spikes in metrics such as average latency and 5xx errors can indicate that S3 may be experiencing issues on the AWS side—if you observe these issues on S3 and the client appears healthy, you can deduce that S3 is the cause of the issue.
Manage your cloud traffic costs
As you scale your cloud resources, it becomes increasingly important to optimize your network traffic costs. Cloud providers charge different rates for traffic depending on whether it is flowing within an availability zone (AZ), between AZs, between geographic regions, or to the open internet, which makes it difficult to understand how these different types of traffic contribute to your bill. Because NPM lets you visualize traffic between key tagged groups like cloud region, AZ, VPC, and service, you can determine the traffic volume associated with each of these different types of communication, and spot inefficiencies.
Identify the culprits of inefficient, cross-regional traffic
To start, you can map traffic from service to region to validate that none of your services are sending traffic to unexpected endpoints. Then, using the tag filters, you can check for undesired cases, such as data flowing between availability zones. The Network view query in the below screenshot helps us identify services that are sending data from region:us-east-2 to services in other regions, thereby contributing to costly cross-regional traffic.

Or, to monitor egress costs, you can scope your destination endpoints to public IP addresses by removing IPs that NPM has automatically categorized as private, with the -IP_type:private filter.
If you tag your services by team or another custom tag, you can easily scope your investigation to only the services a specific team manages and their dependencies, or compare cross-regional or cross-AZ traffic owned by different teams. This empowers teams to be accountable for the cloud costs they generate, and helps cloudops managers quickly audit their teams’ cloud provider usage.
Visualize your network traffic
You can visualize network traffic flow between AZs to quickly spot where cross-AZ traffic and its associated costs are concentrated. By default, the edge weights represent traffic volume, so thick edges point to where the largest cross-AZ communication is occurring.
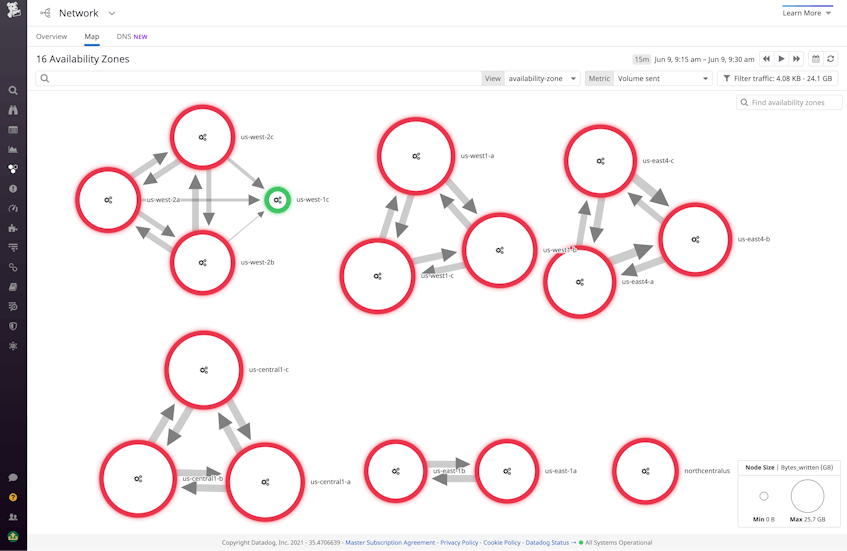
In addition to breaking down traffic-related costs, the map can be used to detect performance and compliance issues. Cross-AZ traffic tends to be more prone to errors and latency than intra-AZ traffic—by switching the edge metric to a performance indicator (retransmits or latency), you can understand which AZs are underperforming. The map also immediately reveals any undesired cross-AZ traffic, such as traffic between US and EU zones that is not GDPR-compliant.
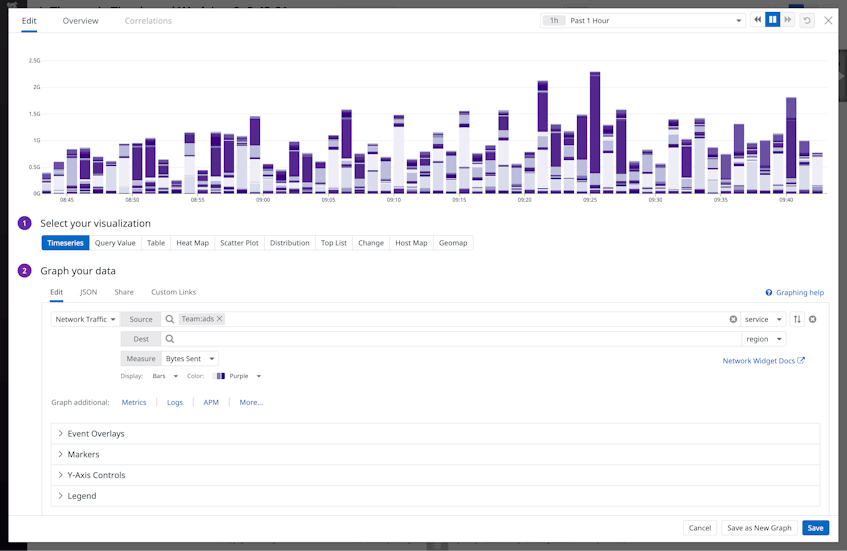
You can also add visualizations of the volume and performance of your cross-regional network communication alongside cloud and service-level metrics in your application or data center-specific dashboards, like in the example below:
Harness the cloud
Cloud migration brings a number of new network-monitoring challenges to the table that can be difficult to address with conventional tools. With Datadog Network Performance Monitoring, you get the visibility and insights you need to diagnose cloud provider outages, optimize your traffic costs, and monitor the health of all your first- and third-party endpoints—and the communication between them—from a single pane of glass. Get started by setting up NPM today. Or if you’re new to Datadog, sign up for a 14-day free trial to get started.
