
In a rapidly expanding, highly distributed cloud infrastructure environment, it can be difficult to make decisions about the design and management of cloud architectures. That’s because it’s hard for a single observer to see the full scope when their organization owns thousands of cloud resources distributed across hundreds of accounts. You need broad, complete visibility in order to find underutilized resources and other forms of bloat. You also need to model your architecture for key processes like compliance audits, cloud cost management, creating onboarding resources, and monitoring infrastructure health.
Cloudcraft is Datadog’s cloud infrastructure modeling solution, enabling users to visualize, document, budget, and plan cloud architectures. With Cloudcraft, you can:
- Automatically generate real-time diagrams of your AWS or Azure architecture and uncover issues
- Refactor your architecture and view the resulting cost estimates
- Easily export and share your architecture documentation for synchronized collaboration
- Filter your diagrams by resource type or tags for granular visibility
We’re pleased to announce enhancements to Cloudcraft that add support for a host of new architecture objects, as well as new ways to navigate between Cloudcraft diagrams and various Datadog monitoring tools. We’re also offering a new pricing model to help users get started with Cloudcraft Pro for free. In this post, we’ll discuss how you can use Cloudcraft to easily create and maintain dynamic architecture models that help you efficiently manage your cloud footprint, and we’ll show you how these new features can help you get more from your diagrams.
Visualize your infrastructure in real time
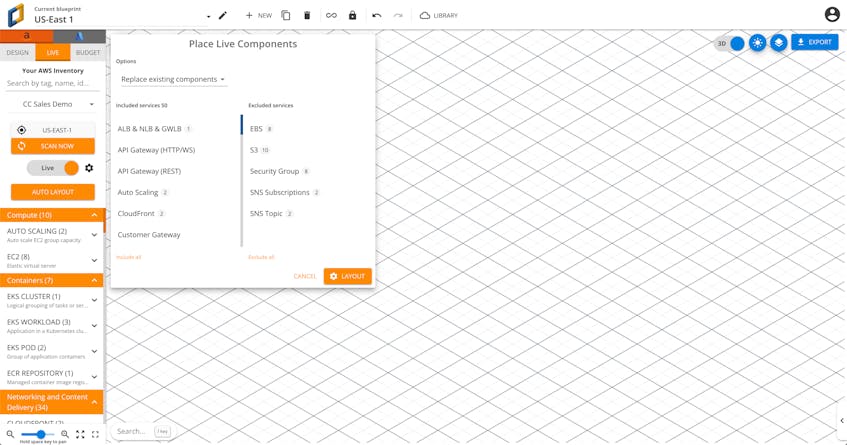
Cloudcraft diagrams map your entire cloud infrastructure in seconds to provide an easily editable and shareable visual representation of your environment. Once you’ve connected Cloudcraft with your AWS and Azure accounts, it can scan your resources and generate a diagram of them with the click of a button. To get a diagram scoped to a particular part of your infrastructure, you can specify which services and regions to include or exclude.
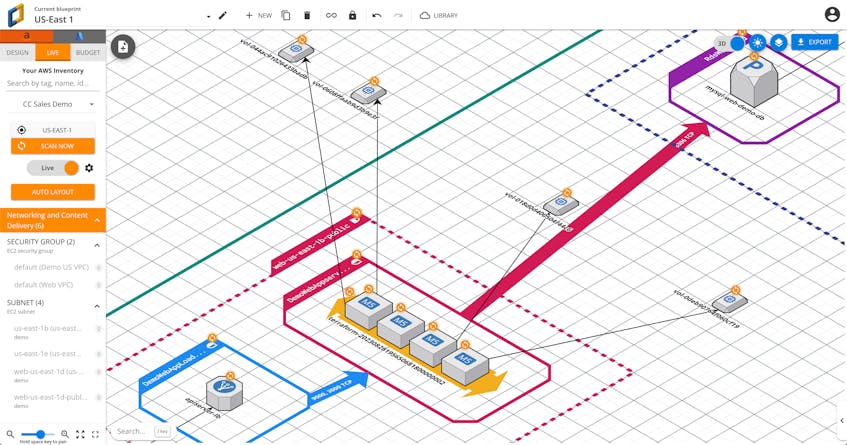
You can see the resulting diagram in the Cloudcraft grid, which neatly lays out all of the objects scanned by Cloudcraft and illustrates their dependency relationships—across databases, container groups, compute instances, and more. The diagram also groups these objects according to their network and security perimeters. You can rescan your resources and update the diagram at any time, so your teammates won’t have to waste time drawing up new static diagrams for every project and watch them go out of date as quickly as they can make them.
Cloudcraft is optimized for AWS and Azure, and can draw diagram components for dozens of key services within those platforms, including established products like Amazon EC2, ELB, Lambda, and Kinesis. New services are continually added—most recently including Amazon Elastic Kubernetes Service (EKS), Azure Kubernetes Service (AKS), Amazon Neptune, AWS Direct Connect, Amazon Timestream, and AWS VPC Endpoints. Cloudcraft supports importing cost information and live components for all of these services.
Cloudcraft’s component integrations go deep enough that you can map all of your services’ subcomponents, as well. For example, with both EKS and now AKS, Cloudcraft enables you to fully visualize your entire Kubernetes stack, from workloads (including Deployments, StatefulSets, DaemonSets, one-off jobs, and cron-jobs) to individual pods.
In addition to the live view offered by auto-scanning your instrumented resources, Cloudcraft lets you easily clone and edit your diagrams to design and propose new architectures. You can even do so collaboratively and in real time, with multiple active cursors from participants working synchronously. Cloudcraft lets you share your diagrams easily by embedding them in Confluence or exporting them to include in compliance docs and proposals.
Document, plan, and budget for your configurations
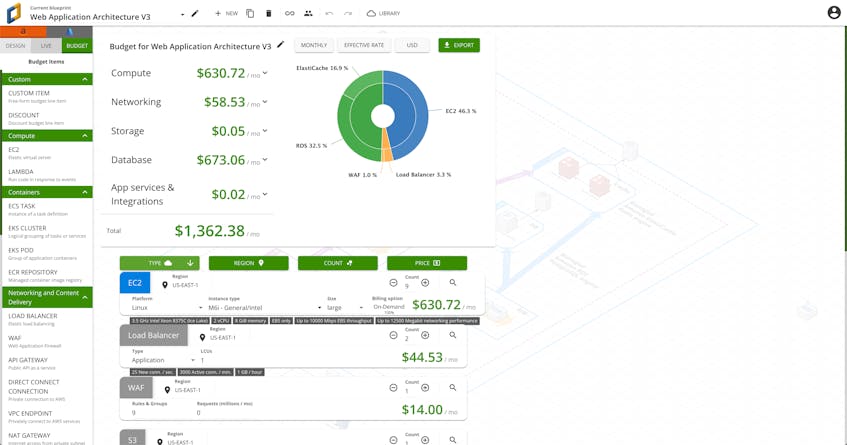
Once you’ve diagrammed your architecture, you can leverage Cloudcraft Budget to get a comprehensive view of your projected spend, with resource-level granularity. Cloudcraft Budget enables developers and architects to get cost estimates for future builds and to better understand the financial impact of their proposed architecture. In the Budget tab, you can see the cost for each service in your architecture, with options for daily, weekly, and monthly projections.
Cloudcraft pulls this cloud cost information directly from your cloud provider accounts. Just like with your architecture diagrams, you can easily export the billing summary for use in compliance reports, presentations, and new architecture proposals. For live cloud cost insights with deeper granularity, check out Datadog Cloud Cost Management.
Supplement your diagram with telemetry from Datadog
Cloudcraft now integrates with Datadog, enabling you to easily navigate from your diagrams to the relevant telemetry data directly within Datadog. For any EC2 instances, RDS databases, ELBs, ALBs, or Lambda services in your diagram, you can use the Bits button to access a number of different links to the Datadog app, which change contextually based on the service you’re looking at. In the following example, you can see links to logs, traces, network telemetry, and more for an EC2 host, as well as a link to that host’s dashboard.
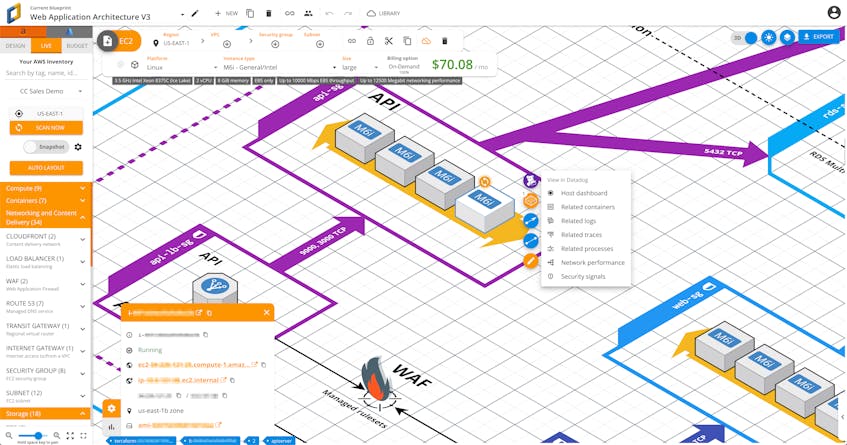
When you hover over a resource, a side panel displays key metadata that can assist in investigations as you dig through logs, traces, and infrastructure metrics. In the preceding example, you can see that the side panel for the selected EC2 instance includes the full hostname and availability zone, relevant IP addresses, and links to the host’s configuration page within AWS. You can easily apply this metadata to add facets to your Datadog log, trace, and network data queries, among others. For example, you might want to use a host’s IP address to filter for network traffic logs from other services sending it requests.
Visualize, learn about, and plan your cloud infrastructure
Accurate, detailed architecture diagrams are highly useful for maintaining an easily interpretable, top-down view of your entire environment. By providing them at the click of a button, Cloudcraft saves teams tons of time as they leverage dynamic diagrams to illustrate their architecture, propose new changes, demonstrate compliance, track cloud spend, and more. And by integrating with Datadog’s comprehensive observability platform, Cloudcraft now helps you leverage your diagrams to track the health and performance of your infrastructure.
Cloudcraft is now available with a new pricing model that includes a free 14-day Pro trial for all new and existing users. By signing up for Cloudcraft Pro, you can access advanced features including live infrastructure scanning. Existing Datadog customers can sign up for Cloudcraft in just a few clicks by using Cloudcraft’s Datadog SSO option. To get started with Datadog, sign up for a free trial.