

In Part 1 of this series, we discussed key metrics for monitoring Microsoft Azure SQL databases. We also looked at how your database resource and audit logs complement metrics to provide more insight into database performance, activity, and security. In this post, we’ll show you how to collect metrics and logs from your database instances and monitor them with Azure’s monitoring and reporting tools. But first, we’ll briefly look at how Azure provides visibility into the health and performance of your databases via the Azure Monitor platform.
An overview of Azure Monitor
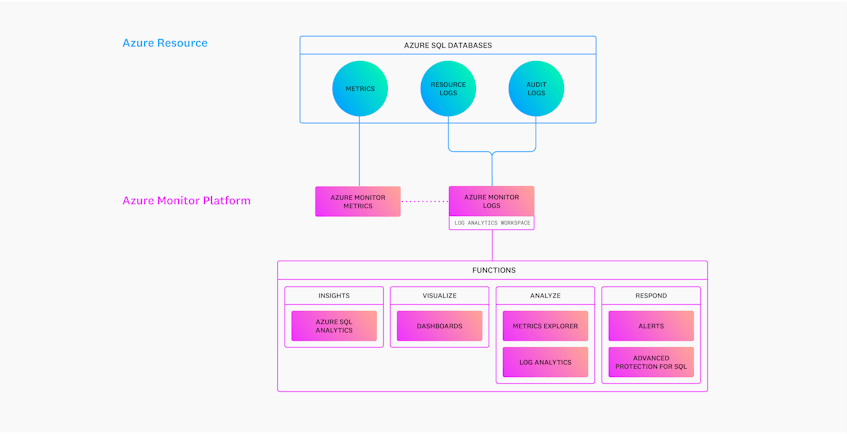
Azure Monitor is the primary hub for getting visibility into your Azure SQL Database instances alongside any other Azure resources that support your applications (e.g., virtual machines, web applications, virtual networks). The platform is available as soon as you provision a resource like an Azure SQL database and provides a suite of tools for processing, analyzing, and alerting on database performance and activity.
Azure Monitor uses dedicated data stores to collect metrics and logs from Azure resources. Metrics are numerical values that report on a particular aspect of a system at a specific point in time whereas logs provide rich, contextual records of system activity. The Azure Monitor Metrics data store automatically collects the metrics discussed in Part 1 and retains them for 93 days by default, so you can instantly use platform tools like alerts and the Metrics Explorer to get a snapshot of a database’s current performance and state.
The Azure Monitor Logs data store, on the other hand, uses a Log Analytics workspace in order to collect logs from databases. A workspace is primarily used as a centralized log collection environment that other Azure services (e.g., Azure Monitor) can leverage for querying, processing, and analytics purposes. You can also route metrics to a workspace in order to view them alongside your logs and retain them for longer periods of time, which enables you to track long-term performance trends.
In order to take advantage of all of Azure Monitor’s features, you will need to manually configure your databases to write metrics and logs to a Log Analytics workspace. We’ll look at how to use some of Azure Monitor’s features in more detail later. Next, we’ll show you how to enable diagnostics and auditing on databases in order to start collecting database metrics and logs.
Collect Azure SQL database metrics and logs
All Azure resources include diagnostics and auditing settings for generating resource and audit logs and forwarding all data, including metrics, to another destination for analysis. You can enable diagnostics on each of your database instances and pooled databases that you want to monitor. This allows you to select the logs you want to export—and enable metric forwarding—to a Log Analytics workspace.
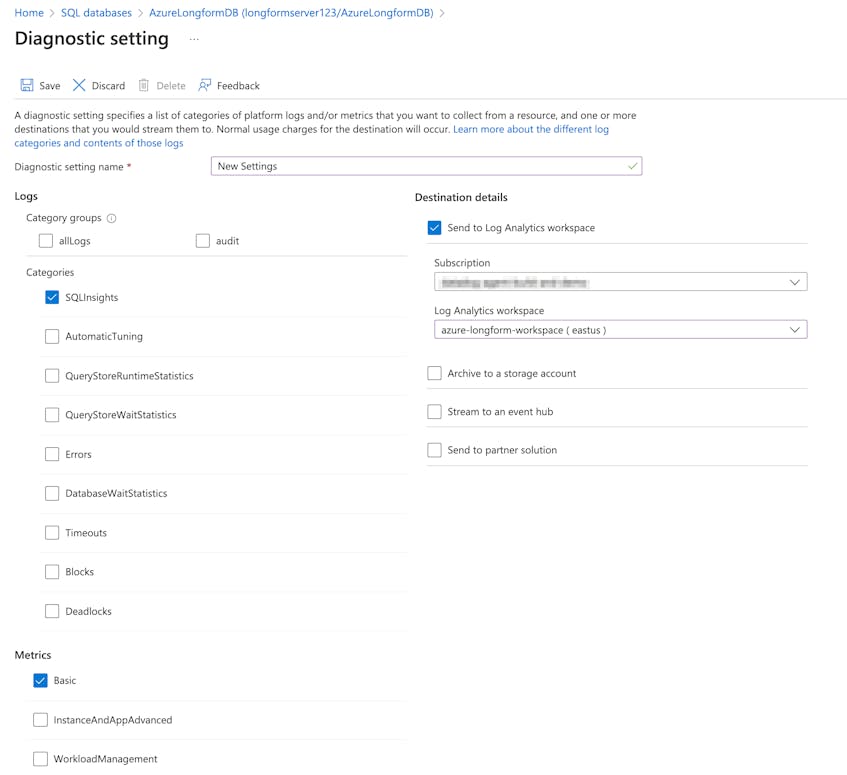
As shown in the example screenshot above, there are several different types of resource logs that you can select. Azure recommends selecting at least the SQLInsights log, which uses built-in detection models to provide recommendations for improving database performance.
Set up auditing for database instances
Enabling diagnostics on a database only generates resource logs. To also generate and collect audit logs, you will need to manually enable auditing on your database instances and pools. You can create auditing policies at either the server or database level, depending on your needs. Server-level policies are useful if you want to apply the same set of auditing rules across all of the database instances managed by a particular SQL server, while database-level policies give you more control over auditing rules per database instance or pool.
To start generating audit logs, navigate to the auditing page of the SQL server or individual databases or pools you want to monitor. Click the “View server settings’’ link to enable server-level auditing or toggle the “Azure SQL Auditing” option on to enable database-level auditing. Finally, set your Log Analytics workspace as the streaming destination for either option. Once configured, Azure will automatically create a new diagnostic setting with the “SQLSecurityAuditEvents” category enabled by default.
It’s important to note that Azure allows you to export database metrics and logs to several destinations, but the Log Analytics workspace is the primary destination for monitoring database performance from within Azure. If you want to monitor database performance using a third-party tool like Datadog, you can configure an Azure Event Hub to forward your metrics and logs. Or, you can use Azure Storage to archive data.
Once you’ve enabled diagnostics and auditing on your database instances and pools, you can leverage all of Azure Monitor’s monitoring and reporting capabilities. We’ll look at a few of the different services Azure provides as part of the Azure Monitor platform to view and analyze database metrics and logs next.
Monitor Azure SQL Database performance and security
Azure Monitor provides several built-in tools for querying, analyzing, and alerting on key database metrics and logs, which you can read more about in Azure’s documentation. For this guide, we’ll focus on:
- Using the Azure SQL Analytics monitoring solution to get deep visibility into database performance issues
- Creating custom alerts to notify you of critical performance issues
- Reviewing database audit logs with Log Analytics to surface potentially malicious database activity
Use Azure SQL Analytics to view database performance
The Azure SQL Analytics monitoring solution, which you can add to your Log Analytics workspace via the Azure Marketplace, provides a comprehensive view of all of your SQL database instances and pools. For example, you can use built-in dashboards to view database performance across several databases, or drill down to a specific metric to view its performance.

Azure SQL Analytics also offers a centralized view of all of your resource logs, including SQLInsights logs (also called Intelligent Insights), which can surface patterns in database performance issues. For example, Intelligent Insights can automatically detect issues caused by database resource consumption reaching service tier limits.
Create alerts on critical database issues
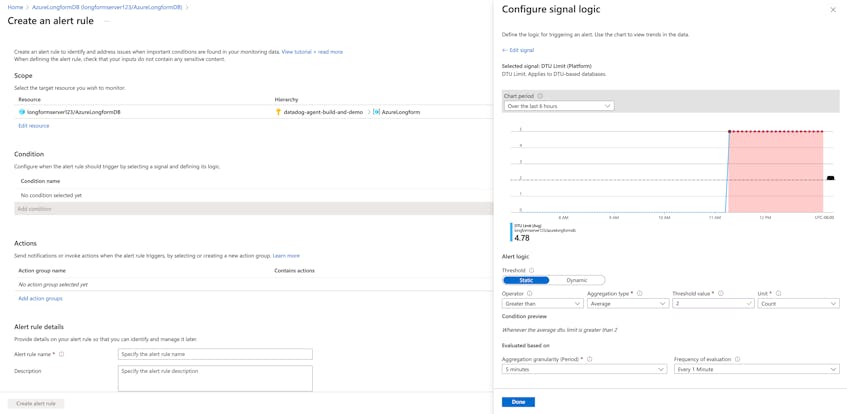
While tools like Azure SQL Analytics enable you to visualize database metrics and review resource logs on demand, it can be difficult to sift through the large volumes of diagnostic data in order to surface legitimate performance issues that could affect your customers. Alerts solve this problem by automatically notifying you of critical performance issues as soon as they happen, so you can cut through the noise and resolve the problem proactively.
You can create custom alerts based on metric values or log queries, including Intelligent Insights logs, to notify you of performance issues that should be addressed immediately, such as a database reaching available DTU limits.
Review audit logs in Log Analytics
Monitoring database performance is only one aspect of ensuring that database instances can support your applications. It’s also critical to monitor database audit logs to ensure that application and customer data is safe. Once you export audit logs to your Log Analytics workspace, you can view them all by navigating to the workspace and running the search "SQLSecurityAuditEvents" query.
As with your metrics, Azure Monitor enables you to visualize database audit events via built-in dashboards, so you can get a better understanding of who is accessing your database and if the data they are accessing is flagged as sensitive.
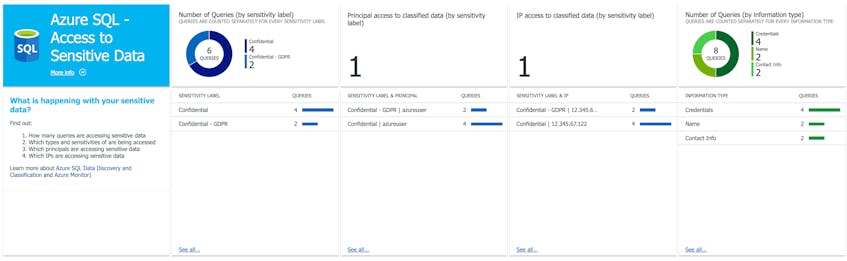
To further protect your data, Azure recommends using Advanced Threat Protection for SQL, which is a type of Azure alert that automatically detects unusual or malicious attempts to access your databases. These alerts can notify you of activity such as SQL injection attacks, privilege abuse, and data leaks. Together with audit logs, these alerts give you full visibility into who is accessing your databases and why, so you can better protect sensitive data, credentials, and more.
Monitor SQL database performance in Azure
In Part 2 of this series, we looked at how to collect metrics, resource logs, and audit logs from your Azure SQL databases and view them using Azure’s suite of monitoring tools. In Part 3, we’ll show you how to export all of this data to Datadog, which provides a unified platform for monitoring database activity and performance.
Acknowledgment
We’d like to thank our friends at Azure for their technical reviews of this post.
