

Azure Service Health continuously notifies you of issues that may affect the availability of your environment, such as service incidents, planned maintenance periods, or regional outages.
We’ve recently enhanced our Azure integration to include additional support for monitoring Service Health issues, enabling you to keep tabs on the health of your Azure environment and take proactive measures to mitigate downtime. Within minutes of setting up the integration, you’ll see rich, contextual Service Health events appear within your event stream, where you can monitor and correlate them with data from more than 700 infrastructure technologies (including other Azure services), all in one place.
Get a cohesive view of Azure Service Health issues
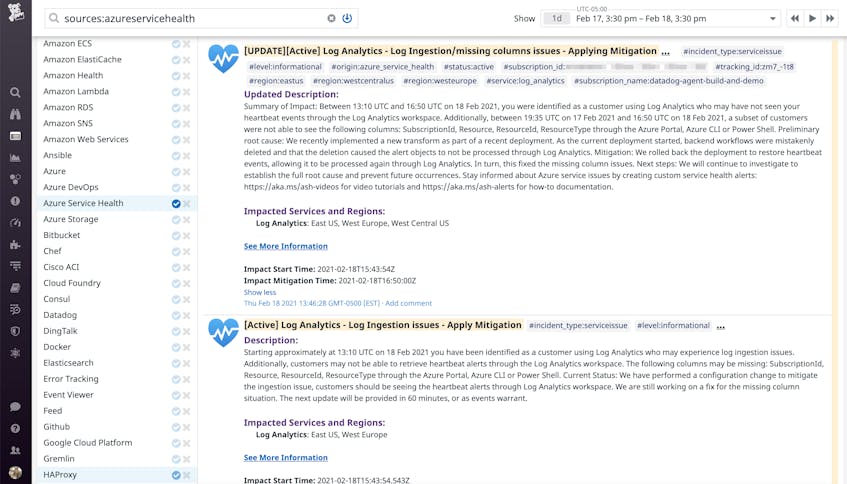
When a new issue is identified, Azure reports an Azure Service Health event indicating the nature of the problem and affected resources and regions. Azure then continuously updates the status of the issue via a series of events until it is finally resolved.
With Datadog, you can clearly monitor every stage of Service Health issues within our event stream under the “Azure Service Health” namespace. Datadog collects these events automatically for all subscriptions being monitored with our Azure integration. You’ll see each issue cohesively grouped by its Tracking ID, enabling you to get full visibility into its current status and progression, from start to finish. This makes it easier for you to keep track of high-priority issues and follow up on their progress.
Slice and dice Azure Service Health events using tags
The Azure Events API provides valuable metadata around each Service Health event. Datadog automatically converts this metadata into key:value tags that you can use to easily filter and search through all your events. To point out a few:
service: The impacted Azure service(s) (e.g., Azure Virtual Machines)status: The status of the event (i.e., active or resolved)region: The impacted Azure region(s) (e.g., US East, Global)incident_type: The type of Service Health event (ServiceIssue, PlannedMaintenance, SecurityAdvisory, HealthAdvisory)level: The severity level of the event (i.e., informational, warning, or critical)
In addition to these tags, each Azure Service Health event includes a description that captures the essence of the issue from the perspective of the Azure engineers investigating the problem. Some events may also contain mitigation steps for addressing the issue and reducing its impact.
Use monitors to proactively track Azure Service Health issues
Once you are capturing Azure Service Health events with Datadog, you can set up event monitors to get notified when a specific type of Azure Service Health issue occurs, using string matching, tags, and more to narrow down the scope. For example, you could use the “Azure Service Health” source and a few tags (status:active, incident_type:serviceissue) to quickly create a monitor that will notify you if any of your Azure services has an active issue. This will help you keep consistent tabs on your mission-critical Azure services and regions—and you won’t have to worry about constantly refreshing an events feed.

Scheduled maintenance events can be extremely annoying if you failed to prepare in advance to offset the performance and availability decline. Now, you can create event monitors to immediately alert you of an upcoming maintenance session, so you can proactively make adjustments to your sprint plans and engineering commitments without missing a beat in productivity.

Use Service Health issues to enrich your dashboards
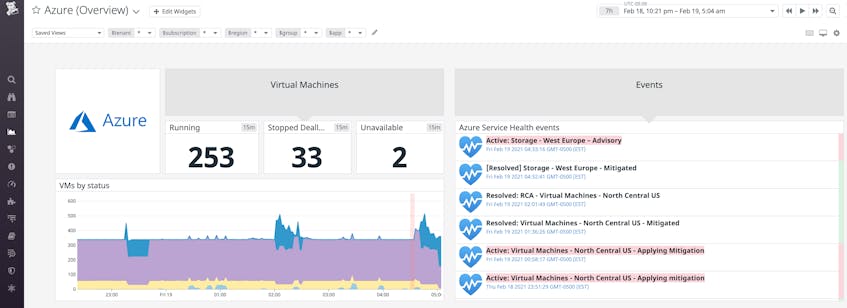
Dashboards help you visualize the state of your infrastructure—but it can sometimes be difficult to fully understand the data displayed in your graphs if you don’t have the added context of what is taking place behind the scenes. With Azure Service Health events in Datadog, you can easily overlay them on graphs to get helpful context for interpreting unusual trends in your metrics and troubleshooting issues.
You can overlay Service Health events on top of mission-critical metrics within your favorite dashboards. In the example below, we are using event overlays to correlate Azure Service Health events with the status of your Azure Virtual Machines. This can help you understand how a single Service Health event, such as a network outage, has affected the status of your entire cloud environment.
Get started with Azure Service Health monitoring
If you’re already using the Azure integration, you should automatically have access to these enhancements—navigate to the event stream and filter for the “Azure Service Health” namespace to see your Azure Service Health events. Otherwise, install Datadog’s Azure integration on the integrations page to start monitoring Azure Service Health events.
If you don’t yet have a Datadog account, sign up for a 14-day free trial to get complete visibility into the health of your Azure environment.
