

When developing web services and tuning the infrastructure that runs them, you’ll want to make sure that they handle requests quickly enough, and at a high enough volume, to meet your requirements. ApacheBench (ab) is a benchmarking tool that measures the performance of a web server by inundating it with HTTP requests and recording metrics for latency and success. ApacheBench can help you determine how much traffic your HTTP server can sustain before performance degrades, and set baselines for typical response times.
While ApacheBench was designed to benchmark the Apache web server, it is a fully fledged HTTP client that benchmarks actual connections, and you can use it to test the performance of any backend that processes HTTP requests. In this post, we will explain how ApacheBench works, and walk you through the ApacheBench metrics that can help you tune your web servers and optimize your applications, including:
- Metrics for request latency, which range from percentile breakdowns of all requests to durations of specific phases within TCP connections.
- Metrics for request and connection status, including HTTP status codes and request failures.
How ApacheBench works
Installing ApacheBench
ApacheBench is a command line tool that is bundled in the apache2-utils package. To install ab, run the following commands on Debian/Ubuntu platforms:
apt-get update
apt-get install -y apache2-utils
Configuring ApacheBench
ApacheBench allows you to configure the number of requests to send, a timeout limit, and request headers. ab will send the requests, wait for a response (up to a user-specified timeout), and output statistics as a report.
You can run an ApacheBench command with the following format:
ab <OPTIONS> <WEB_SERVER_ADDRESS>/<PATH>The only required argument is the address of the web server, followed by a / (URLs without the trailing / will cause ab to return an error) and an optional URL path. If you don’t specify any options, ApacheBench will send a single request. ab’s options allow you to adjust the volume of requests, as well as (for specialized cases) their headers and request bodies. Some commonly used options include:
-n: The number of requests to send-t: A duration in seconds after whichabwill stop sending requests-c: The number of concurrent requests to make
If you’re using both the -t and the -n flags, note that-t should always go first—otherwise ApacheBench will override the value of -n and assign the default -n value of 50000, or 50,000 requests. Additionally, ab runs on a single thread—the -c value tells ab how many file descriptors to allocate at a time for TCP connections, not how many HTTP requests to send simultaneously. The -c flag does allow ab to complete its tests in less time, and simulates a higher number of concurrent connections. The two timeseries graphs below, for example, show the number of concurrent connections as well as requests per second for the command:
ab -n 100000 -c 1000 <SERVER_ADDRESS>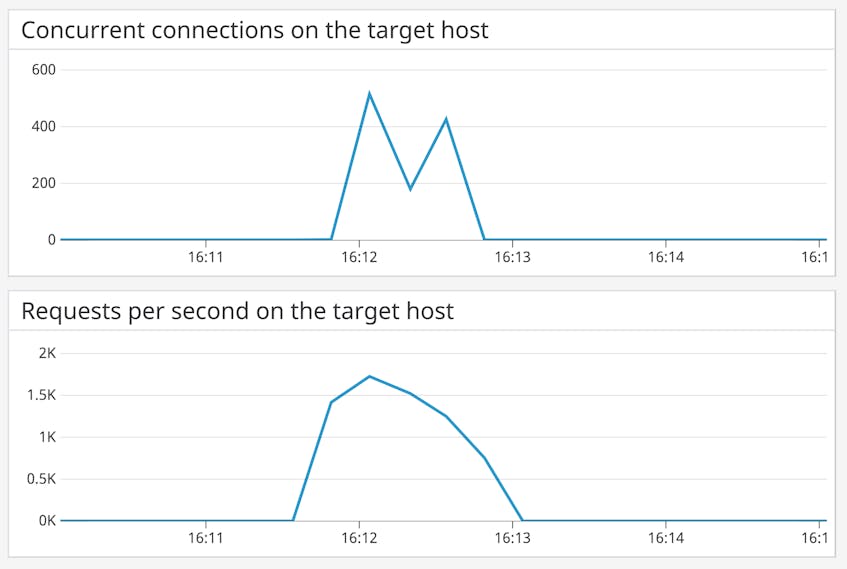
Constraints
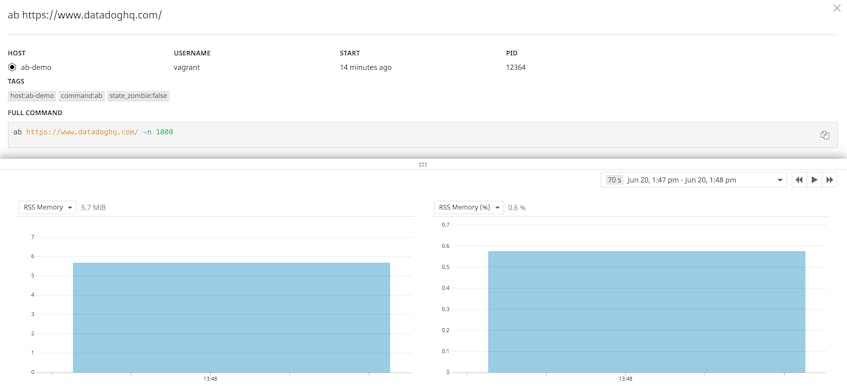
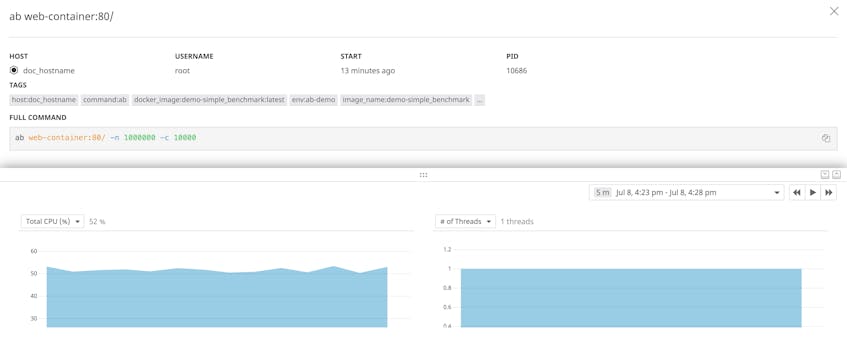
When using ApacheBench, you’ll want to understand its constraints, which stem from the fact that ab measures actual HTTP requests between two servers that may or may not run on the same host. First, you’ll want to make sure that the host conducting an ab test has enough CPU resources to make all TCP connections you’ve specified, as well as enough memory available to store the state of each connection (ab allocates memory based on the number of requests).
Other constraints include the fact that ApacheBench’s send-everything-at-once approach may not reflect the way your application handles requests over time; and the distance between the server and ab client (e.g., the same host or different availability zones) will affect latency scores. As a result, ab requests may not reflect the sorts of latencies you can expect to see in your usual production load. You’ll get the most out of ApacheBench when using the relative results of your tests—not “How fast are responses?” but “Are responses getting faster?"—to see how effective your efforts are to optimize your application code, server configuration, load balancing architecture, and so on.
How to interpret ApacheBench
After finishing its tests, ApacheBench produces a report that resembles the code snippet below. Later in this section, we will explain the different metrics provided in this report, such as:
- How long requests took to complete, including latency for different parts of the request-response cycle
- How successful the requests were, including how many requests received non-2xx responses, and how many requests failed
Server Software:        AmazonS3
Server Hostname:       <SOME_HOST>
Server Port:            443
SSL/TLS Protocol:       TLSv1.2,ECDHE-RSA-AES128-GCM-SHA256,2048,128
TLS Server Name:        <SOME_HOST>

Document Path:          /
Document Length:        45563 bytes

Concurrency Level:      2
Time taken for tests:   3.955 seconds
Complete requests:      100
Failed requests:        0
Total transferred:      4625489 bytes
HTML transferred:       4556300 bytes
Requests per second:    25.29 [#/sec] (mean)
Time per request:       79.094 [ms] (mean)
Time per request:       39.547 [ms] (mean, across all concurrent requests)
Transfer rate:          1142.21 [Kbytes/sec] received

Connection Times (ms)
              min  mean[+/-sd] median   max
Connect:       40   53   8.1     51      99
Processing:    12   24   9.4     23      98
Waiting:        5   14  10.6     12      95
Total:         57   77  15.0     75     197

Percentage of the requests served within a certain time (ms)
  50%     75
  66%     77
  75%     80
  80%     81
  90%     85
  95%     92
  98%    116
  99%    197
 100%    197 (longest request)
Request latency metrics
Top-level request latency metrics
Time taken for tests
Time taken for tests measures the duration between when ApacheBench first connects to the server and when it receives the final response or is interrupted with Ctrl-C. This metric is useful if you’re conducting repeated ab tests while optimizing your application or tuning your web server, and want a single score to consult for signs of improvement.
Time per request
ApacheBench provides two variations on this metric, and both depend on the number of responses that ab has finished processing (done), as well as the value of the metric Time taken for tests (timetaken). Both multiply their results by 1,000 to get a number in milliseconds.
The first Time per request metric doesn’t take the concurrency value into account:
timetaken * 1000 / doneThe second version of Time per request accounts for the number of concurrent connections the user has configured ab to make, using the -c option (concurrency):
concurrency * timetaken * 1000 / doneIf you set a -c value greater than 1, the second Time per request metric should (in theory) provide a more accurate assessment of how long each request takes.
You should treat both Time taken for tests and Time per request as rough indicators of web server performance under specific levels of load. Tracking these values over time can help you assess your optimization efforts, and unusually high or low values can point to CPU saturation on the web server, code changes, or other events that you’ll want to investigate in more detail.
Metrics for individual requests
For each connection it makes, ab stores five timestamps:
start: whenabbegan making a connection with the web serverconnect: whenabfinished making the connection and began writing the requestendwrite: whenabfinished writing the requestbeginread: whenabbegan reading from the responsedone: whenabclosed the connection
ab uses these timestamps to create a data object for each connection, containing the following properties:
starttime: thestartpropertywaittime: How longabspent waiting before it began reading from the response, after it finished writing the request (i.e.,beginread - endwrite)ctime: How longabspent making a connection with the web server (i.e.,connect - start)time: How longabspent handling the connection, from the beginning of its attempt to contact the server to when the connection closed (i.e.,done - start)
From there, ab uses the data object to calculate the remaining latency-related metrics: aggregated connection times, percentiles, and, if you use the -g flag, data for individual requests.
Aggregated connection times
After inspecting ApacheBench’s top-level latency metrics, you can track the duration of different stages of the request-response cycle. ab aggregates properties from its per-request data objects to calculate the min, mean, sd (standard deviation), median, and max of each stage, all in milliseconds:
- Connect: How long it takes
abto establish a TCP connection with the target server before writing the request to the connection (ctime) - Processing: How long the connection was open after being created (
time - ctime) - Waiting: How long
abwaits after sending the request before beginning to read a response from the connection (waittime) - Total: The time elapsed from the moment
abattempts to make the connection to the time the connection closes (time)
The output will resemble the following:
Connection Times (ms)
              min  mean[+/-sd] median   max
Connect:       42   71  24.3     63     198
Processing:    13   32  11.5     33      80
Waiting:        5   19  10.7     15      40
Total:         65  103  30.9     95     233
These metrics give you a more nuanced understanding than Time taken for tests and Time per request, allowing you to see which part of the request-response cycle was responsible for the overall latency. Further, these metrics are based on the data object for each request, rather than the start and end times of ab’s tests.
In the above example, we can see that Connect was on average (i.e., in both mean and median) the longest part of the cycle, though also the one with the highest standard deviation. Since the Connect metric depends on client latency as well as server latency, we could investigate each of these, determining which side of the connection is responsible for the variation. Then we’d consider focusing our optimization efforts on how our backend handles new TCP connections.
Percentiles
The final ApacheBench report also includes a breakdown of request latency percentiles, giving you a more detailed view of request latency distribution than the standard deviations within the Connection Times table. The percentile breakdown resembles the following. In the report, “certain time” refers to the value of the time property (defined above).
Percentage of the requests served within a certain time (ms)
  50%     95
  66%    102
  75%    107
  80%    115
  90%    138
  95%    163
  98%    229
  99%    233
 100%    233 (longest request)
Unlike the Connection Times table, these metrics are not broken down by stage of the request-response cycle. As a result, ab’s latency metrics are best viewed together to get a comprehensive view of web server performance:
- Use the top-level latency metrics to get a quick read of the server’s overall performance, especially in comparison to other
abtests applied in similar conditions. - From there, use the higher-granularity aggregated connection times to find out which part(s) of the request-response cycle to investigate further.
- Finally, percentiles tell you how much variation there is between the fastest and slowest requests, so you can address any long-tail latencies.
Latency of individual requests
ApacheBench can also display data about each connection in tab-separated values (TSV) format, allowing you to calculate values that are not available within the standard ab report, such as wait time percentiles. This data comes from the same data objects that ab uses to calculate Connection Times and percentiles. These per-request values are:
starttime: The time the connection began, printed in thectime()format (from thestarttimeproperty of the connection)seconds: The same value asstarttime, but given as the number of seconds since the Unix Epochctime: The time it takes to connect to the server before making this request, in millisecondsdtime: How long an established connection was open, in milliseconds (i.e,time - ctime)ttime: The total time spent on this connection (i.e., thetimeproperty) in millisecondswait: The time spent waiting between sending the request and reading from the response (i.e., thewaittimeproperty), in milliseconds)
To access per-request data in TSV format, use the -g flag in your ab command, specifying the path to the output file. For example, let’s say you run this command:
ab -n 100 -g /path/to/plot.tsv <WEB_SERVER_ADDRESS>The first five rows of the data in the plot.tsv file will resemble the following.
starttime	seconds	ctime	dtime	ttime	wait
Tue Jun 18 15:56:10 2019	1560887770	46	14	60	6
Tue Jun 18 15:56:07 2019	1560887767	48	15	63	7
Tue Jun 18 15:56:11 2019	1560887771	51	13	63	6
Tue Jun 18 15:56:12 2019	1560887772	47	17	64	12
Tue Jun 18 15:56:06 2019	1560887766	46	20	66	9
The -g flag gives you flexibility in how you analyze request data. You could, for example, plot the dtime of each request in a timeseries graph (i.e., by using gnuplot, spreadsheet software, or a graphics library), indicating whether increased load on the server affected the performance of requests after a certain point.
Success metrics
Since ApacheBench makes real requests to an HTTP server, it’s important to understand the sorts of responses your web servers are returning. ab allows you to track both non-2xx response codes and errors that arise when making requests.
Non-2xx responses
One way to understand the responses from your web servers is to count those that return an error or a failure. This is helpful if your goal is to benchmark deliberately unsuccessful requests (e.g., the time it takes to load a 404 page after a redesign), or requests that are not guaranteed to return a successful response (e.g., in production environments).
It’s important to know that ab will classify 3xx, 4xx, and 5xx response codes as Non-2xx responses, and report this metric in a format similar to this:
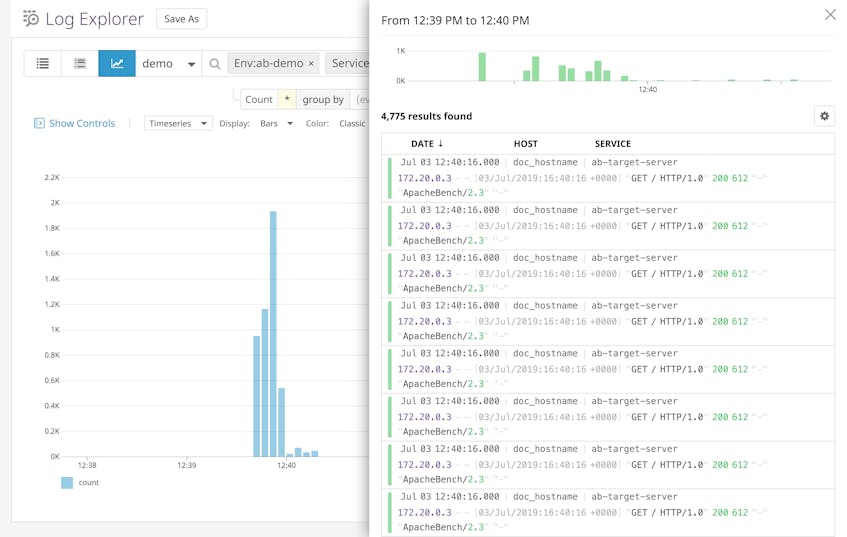
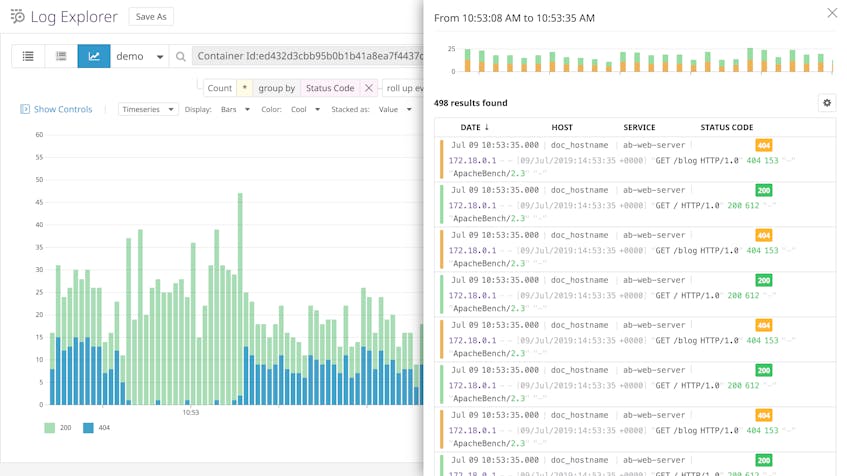
Non-2xx responses: 10You can see which status codes make up the “non-2xx” responses by adding the -v <INTEGER> option when running ab, where a value of 2 will show the headers and body of each response in STDOUT. You can also send HTTP logs from your server to a dedicated monitoring platform like Datadog to aggregate responses by status code.
Complete versus failed requests
Connections between ApacheBench and your web server can fail just like any TCP connection, and ab counts failures within four different categories:
- Length: After the first response, a subsequent response displays varying content length (in bytes)
- Connect:
ab’s attempt to connect to a server results in an error - Receive:
abencounters an error when reading data from the connection - Exceptions:
abencounters an error while setting up file descriptors for making TCP connections
The following comes from running an ab command with the -n option set to 1000 and the URL set to www.google.com/.
Complete requests:      1000
Failed requests:        992
   (Connect: 0, Receive: 0, Length: 992, Exceptions: 0)
The high number of Length-related errors is likely due to Google’s dynamic content. In a well-known bug (since marked as “a bug which will never be fixed”),ab will treat requests as failures if the content length of their responses is variable. This is because ab stores the length of the first response it receives, and compares subsequent lengths to that value. This means that you should disregard length-related failures when you’re using ab to test dynamic sites.
In general, the Failed request metrics monitor activity at the transport layer, i.e., with your TCP connections, rather than at the application layer. If you see nonzero results for Failed requests, you’ll want to investigate your web server for possible issues with handling TCP connections.
ApacheBench metrics for better benchmarking
In this post, we’ve shown you how to use ApacheBench to measure the performance of your HTTP servers, explored some limitations of ApacheBench, and explained the metrics that ApacheBench can provide. You can also use Datadog to get full visibility into your HTTP servers, including Apache, NGINX, and Gunicorn, along with 700 other technologies. Datadog can provide complete visibility into HTTP response latency by analyzing server logs, tracing requests as they travel across distributed services, collecting network metrics from your hosts, and simulating HTTP requests from clients around the world—check out our free trial.
