Auto Instrumentation | Datadog

Auto Instrumentation

Instrument your application automatically to monitor and measure performance with minimal effort.

Auto instrumentation has become a standard for monitoring, maintaining, and measuring the performance of modern, more complex applications. Instrumenting applications automatically eliminates the need for adding lines of code manually to send trace data, enabling developers to focus on top priority tasks. Auto instrument your Java, Python, Ruby, .Net, Node.js, PHP, and Go applications using Datadog.


Zero-touch auto instrumentation

Auto instrument your application to reduce engineering effort and decrease code cruft.
  • Avoid human errors and an inconsistent treatment of observability data when instrumenting your application manually
  • Eliminate the burden of standardizing what to instrument and never accidentally miss critical tracing information with auto instrumentation
  • Save time on instrumentation and devote your time to building your core product and monitoring its performance
Zero-touch auto instrumentation

Effortless application performance monitoring

Measure service and code performance without modifying your application code.
  • Follow requests, errors, and latency instantly, without making changes to the source code of your services
  • Send production-level code profiles from across your distributed system with minimal time spent instrumenting applications
  • Understand the impact of code deployments on service dependencies automatically and instantly
Effortless application performance monitoring

Quick and seamless end-to-end distributed tracing

Correlate auto-instrumented distributed traces with all other telemetry.
  • View distributed traces, infrastructure metrics, logs, live processes, network calls, RUM sessions, and code profiles in context
  • Seamlessly tie backend traces to real user sessions captured in the frontend
  • Pinpoint error and latency outliers with out-of-the-box service dashboards and machine learning
Quick and seamless end-to-end distributed tracing

The Essential Monitoring and Security Platform for the Cloud Age

Datadog brings together end-to-end traces, metrics, and logs to make your applications, infrastructure, and third-party services entirely observable.

platform_diagram_lpg

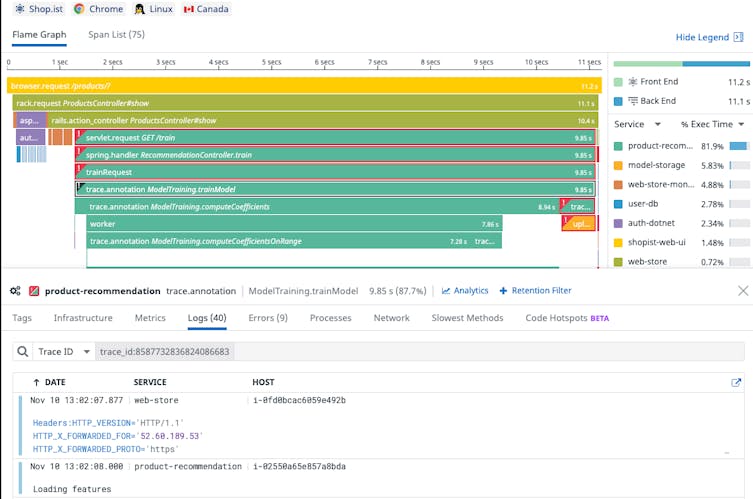
Auto Instrument Your Applications with Datadog

Proactively track and troubleshoot application performance.
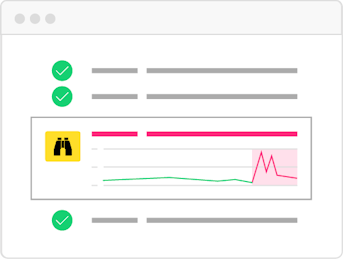
watchdog-apm-illustration.png

Watchdog

Auto-detect and surface performance problems without manual alert configuration.
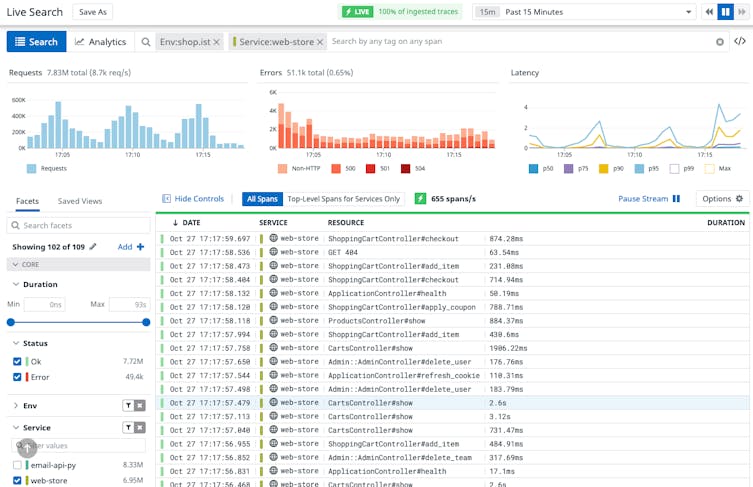
tracesearch-apm-illustrationv2.png

App Analytics

Search, filter, and analyze Java stack traces at infinite cardinality.
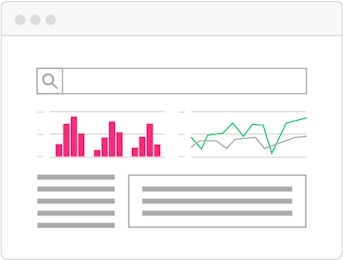
servicemap-apm-illustration.png

Root Cause Analysis

Full stack correlation from synthetic tests to metrics, traces, and logs.

Loved & Trusted by Thousands

Washington Post logo 21st Century Fox Home Entertainment logo Peloton logo Samsung logo Comcast logo Nginx logo