Using Rsyslog to send logs to Datadog
June 3, 2024
Introduction
Rsyslog is an open source software utility for collecting and forwarding log messages over the network to a variety of destinations. Rsyslog can accept inputs from a wide variety of sources, transform them, and output the results to a variety of destinations over the network. Rsyslog has a strong enterprise focus but also scales down to small systems; it is a popular and widely used log shipper and is preinstalled in many Linux distributions.
Many companies already run Rsyslog in their environments and often desire to only update or replace as few components of their architecture as possible. Net-new architectures can also benefit from the maturity of Rsyslog and the open source community. Datadog supports Rsyslog as a log shipper to meet our customers’ technology and business needs. While Rsyslog can send directly to Datadog’s logs API intake, it cannot do so over secure transport (TLS) without additional software packages and configuration—a prerequisite in modern architectures. This is why this architecture injects the Datadog Agent as a battle-tested and scalable mechanism for shipping logs over HTTPS. Adding the Datadog Agent also has the added benefit of introducing compression options for the log events being sent, saving on network egress costs and observability for the servers running Rsyslog, which are often centralized systems in large-scale logging architectures.
Explanation of the architecture
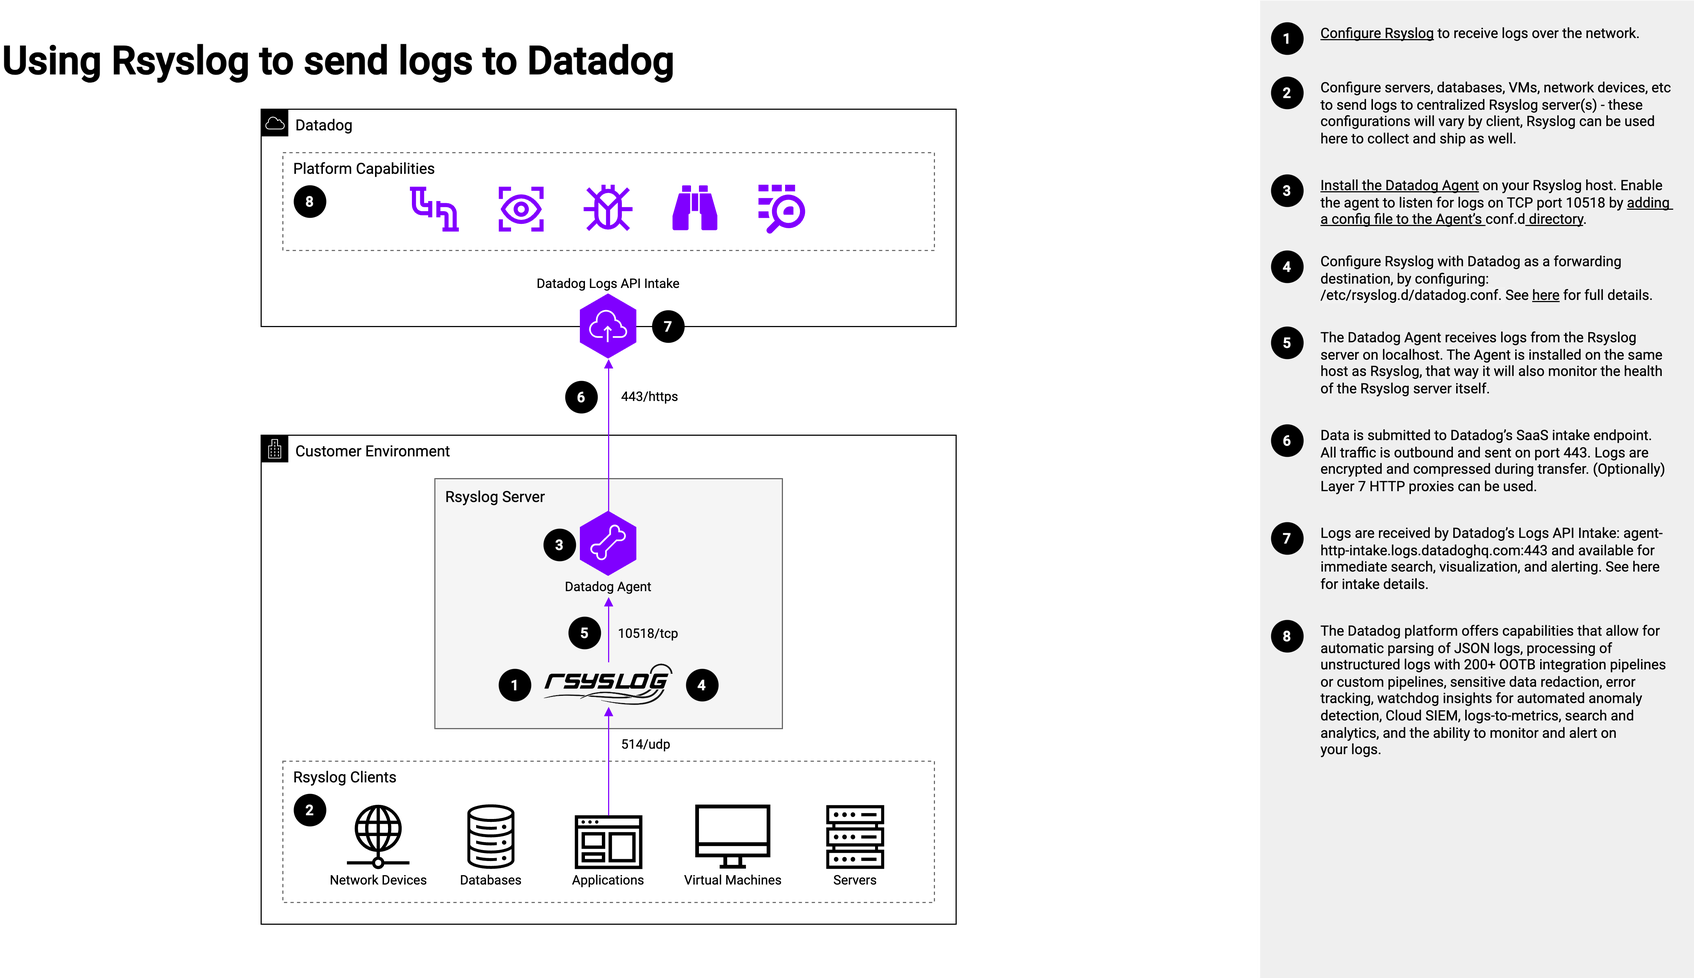
The proposed reference architecture for consolidating observability in EDAs includes the integration of monitoring, logging, and tracing systems into a unified platform. We can break down the proposed architecture into two basic parts: application concerns (with communication arrows in black color) and observability concerns (with communication arrows in purple color). Let’s go through this step by step:
- Step 1
Configure Rsyslog to receive logs over the network.
- Step 2
Configure servers, databases, VMs, network devices, etc to send logs to centralized Rsyslog server(s)—these configurations will vary by client. Rsyslog can be used here to collect and ship as well.
- Step 3
Install the Datadog Agent on your Rsyslog host. Enable the agent to listen for logs on TCP port 10518 by adding a config file to the Agent’s
conf.ddirectory, as seen below:logs: - type: tcp port: 10518 service: "<APP_NAME>" source: "<CUSTOM_SOURCE>"See here for full details.
- Step 4
Configure Rsyslog with Datadog as a forwarding destination by configuring
/etc/rsyslog.d/datadog.conf
See here for full details. Below is an example config:## For each file to send input(type="imfile" ruleset="infiles" Tag="<APP_NAME_OF_FILE1>" File="<PATH_TO_FILE1>") ## Set the Datadog Format to send the logs $template DatadogFormat,"<%pri%>%protocol-version% %timestamp:::date-rfc3339% %HOSTNAME% %app-name% - - - %msg%\n" ## Define the destination for the logs ruleset(name="infiles") { action(type="omfwd" target="127.0.0.1" protocol="tcp" port="10518" template="DatadogFormat") } - Step 5
The Datadog Agent receives logs from the Rsyslog server on
localhost. The Agent is installed on the same host as Rsyslog so that it will also monitor the health of the Rsyslog server itself. - Step 6
Data is submitted to Datadog’s SaaS intake endpoint. All traffic is outbound and sent on port 443. Logs are encrypted and compressed during transfer. Optionally, Layer 7 HTTP proxies can be used.
- Step 7
Logs are received by Datadog’s ingest endpoint:
agent-http-intake.logs.datadoghq.com:443and available for immediate search, visualization, and alerting.
See here for intake details. - Step 8
The Datadog platform offers capabilities that allow for automatic parsing of JSON logs, processing of unstructured logs with 200+ OOTB integration pipelines or custom pipelines, sensitive data redaction, Error Tracking, Watchdog Insights for automated anomaly detection, Cloud SIEM, logs-to-metrics, search and analytics, and the ability to monitor and alert on your logs.
Authors
Chris Kelner, Product Solutions Architect