Observability in Event-Driven Architectures
November 20, 2024
Unifying Observability in Event-Driven Architectures: A Path to Enhanced System Performance and Reliability
In the rapidly evolving software development landscape, Event-Driven Architectures (EDA) stand out for their scalability, flexibility, and ability to facilitate real-time data processing. These architectures involve decomposing a large, monolithic application into smaller, independent services that communicate with each other through events. However, the complexity of these distributed systems necessitates a robust approach to observability. In these scenarios, observability is not just a tool but a comprehensive strategy that enables organizations to gain deep insights into their systems, ensuring reliability, performance, and overall success.
Explanation of the architecture
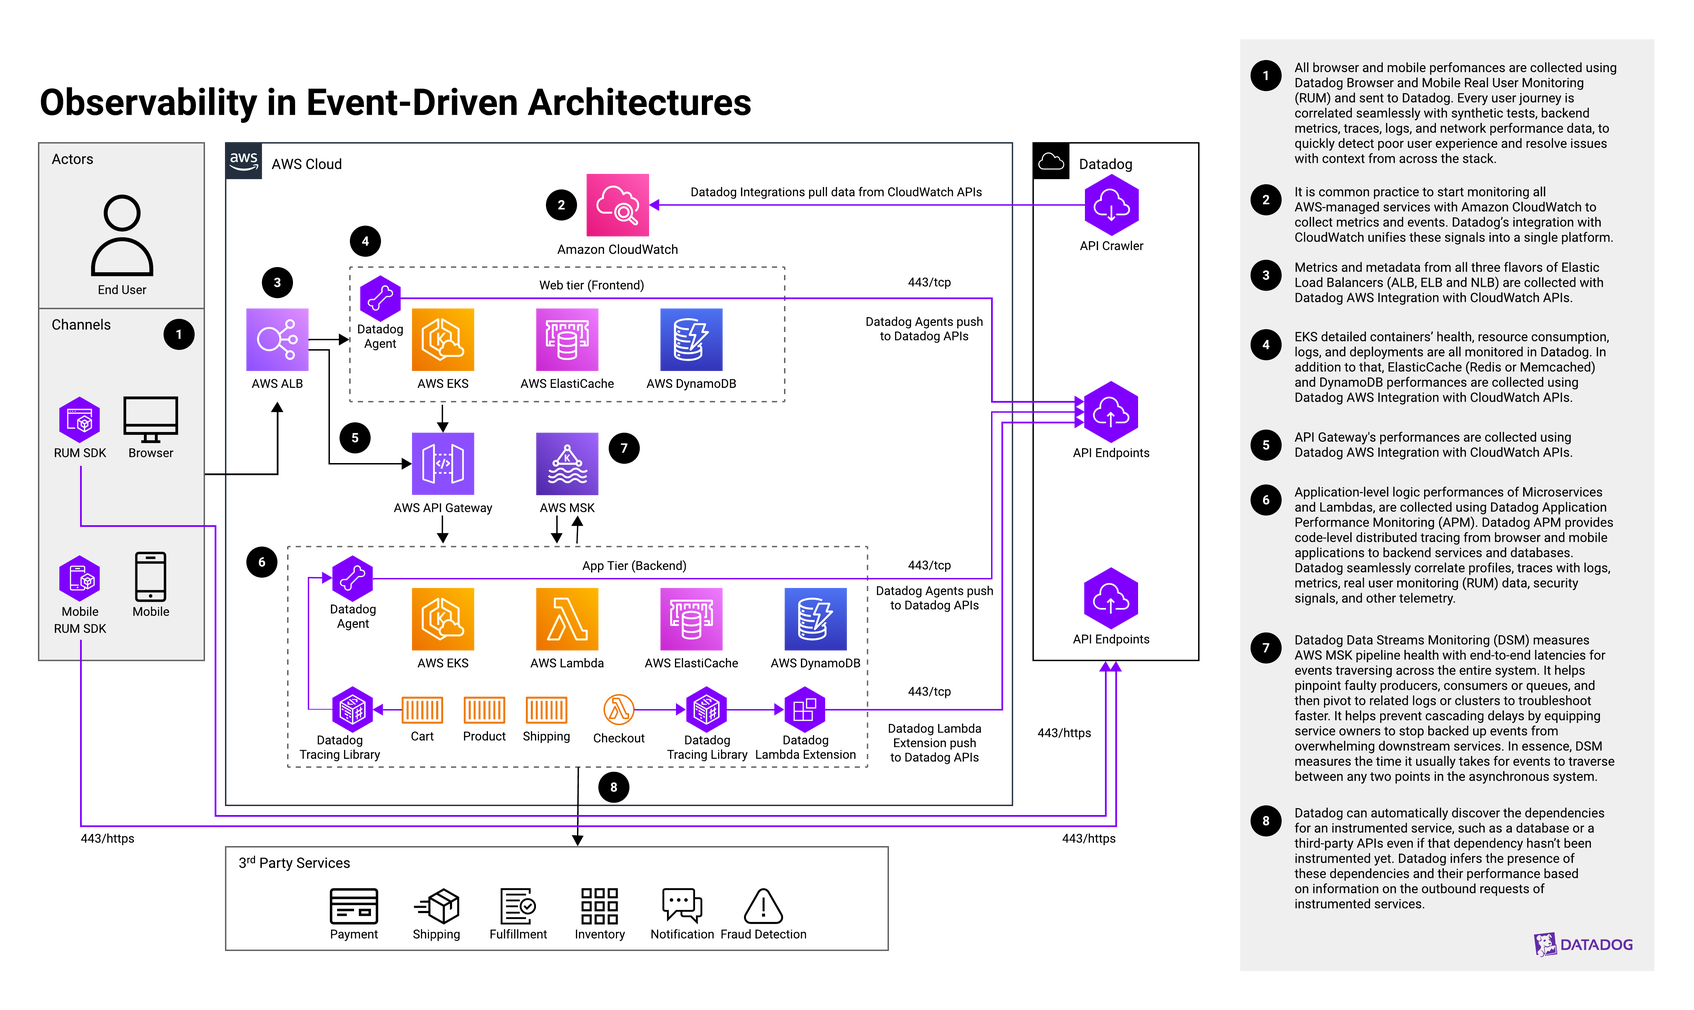
The proposed reference architecture for consolidating observability in EDAs includes the integration of monitoring, logging, and tracing systems into a unified platform. We can break down the proposed architecture into two basic parts: application concerns (with communication arrows in black color) and observability concerns (with communication arrows in purple color). Let’s go through this step by step:
- Step 1
As end users interact with web and mobile applications, all browser and mobile performances are collected using Datadog Browser and Mobile Real User Monitoring (RUM) and sent to Datadog. Every user journey is correlated seamlessly with synthetic tests, backend metrics, traces, logs, and network performance data to quickly detect poor user experience and resolve issues with context from across the stack.
- Step 2
It is common practice to start monitoring all AWS-managed services with Amazon CloudWatch to collect metrics and events. Datadog’s integration with CloudWatch unifies these signals into a single platform.
- Step 3
As end-user requests go through Elastic Load Balancing, which passes them to other services, metrics and metadata from all three flavors of load balancers (ALB, ELB, and NLB) are collected with the Datadog AWS integration through CloudWatch APIs.
- Step 4
As applications rely on Amazon Elastic Kubernetes Service (EKS), detailed containers’ health, resource consumption, logs, and deployments are all monitored in Datadog. In addition to that, AWS ElasticCache (Redis or Memcached) and Amazon DynamoDB performances are collected using the Datadog AWS integration through CloudWatch APIs.
- Step 5
As end-user requests go through Amazon API Gateway, performance is collected using the Datadog AWS integration with CloudWatch APIs.
- Step 6
As requests reach downstream services, application-level logic performances of microservices and Lambda functions are collected using Datadog Application Performance Monitoring (APM). Datadog APM provides code-level distributed tracing from browser and mobile applications to backend services and databases. In addition, Datadog Continuous Profiler helps find CPU, memory, and I/O bottlenecks in application code to significantly reduce end-user latency and infrastructure costs. Lastly, Datadog Serverless Monitoring provides distributed tracing for functions to bring detailed, real-time insights into AWS Lambda-based applications. It also brings the same level of visibility to the rest of the AWS-managed services that interact with Python and Node.js Lambda functions, such as API Gateway, SQS, SNS, Kinesis, S3, and DynamoDB. Datadog seamlessly correlates traces with logs, metrics, profiles, RUM data, security signals, and other telemetry.
- Step 7
To get visibility into the asynchronous nature of event-driven architectures, Datadog Data Streams Monitoring (DSM) measures AWS Managed Streaming for Apache Kafka (MSK) pipeline health with end-to-end latencies for events traversing across the entire system. DSM helps pinpoint faulty producers, consumers, or queues so users can pivot to related logs or clusters to troubleshoot faster. It helps prevent cascading delays by equipping service owners to stop backed up events from overwhelming downstream services.
- Step 8
As the applications can interact with many external third-party services, Datadog can automatically discover the dependencies for an instrumented service, such as a database or third-party API, even if that dependency hasn’t been instrumented yet. Datadog infers the presence of these dependencies and their performance based on the outbound requests of instrumented services.
Challenges
While this architecture offers significant benefits, it also introduces a set of challenges that need to be carefully managed:
Service Discovery and Management: With many microservices interacting in an EDA, managing and discovering services becomes complicated. Systems need robust mechanisms to track services’ availability and locations.
Data Consistency: Ensuring data consistency across distributed services is challenging, especially when dealing with asynchronous communication and eventual consistency models.
Observability and Monitoring: Due to the asynchronous nature of data flows, tracking the behavior and health of distributed systems across multiple services and events requires advanced monitoring and observability tools.
Integration and Testing: Testing the interactions between microservices and ensuring that the entire system works as expected can be complex. Integration tests and end-to-end testing strategies become more critical and challenging to implement.
Configuration Management: Managing configurations for numerous services across different environments can become cumbersome.
Deployment Complexity: Continuous integration and continuous deployment (CI/CD) practices become more complex, requiring automation and sophisticated deployment strategies to manage frequent, independent deployments of services.
Network Latency and Performance: The asynchronous communication and dependency on network calls between services can introduce latency and affect overall system performance.
Security Concerns: The increased attack surface due to multiple services and communication points requires comprehensive security strategies, including service-to-service authentication and encryption.
Learning Curve: Teams may face a steep learning curve as they adapt to new technologies, patterns, and practices associated with microservices and event-driven systems.
Cultural and Organizational Changes: Adopting microservice EDAs often requires significant cultural and organizational changes, promoting autonomy, accountability, and a shift towards DevOps practices.
The Imperative for Consolidated Observability
Observability in EDAs goes beyond traditional monitoring, offering a multi-dimensional view of a system’s state through metrics, logs, and traces. It provides real-time insights, enhanced understanding, and the ability to quickly identify and isolate faults. These capabilities are crucial for optimizing performance, ensuring operational efficiency, and enhancing the customer experience. However, the dispersed nature of microservices and the asynchronous communication patterns in EDAs pose significant challenges to achieving a cohesive observability strategy. The solution lies in consolidating observability tools into a unified architecture that offers a holistic view of the entire ecosystem.
Key Benefits of Implementing Consolidated Observability
Enhanced System Understanding: A consolidated observability platform provides a comprehensive view of microservice interactions and real-time system performance, facilitating immediate responses to operational changes or issues.
Improved Fault Detection and Isolation: Integrated tools enable quick identification of anomalies and detailed root cause analysis, significantly reducing downtime and enhancing system reliability.
Operational Efficiency and Reliability: Continuous monitoring and automated alerting systems proactively identify potential issues, ensuring system availability and reliability.
Performance Optimization: A unified observability approach allows for precise bottleneck identification and informed scaling decisions, ensuring optimal resource utilization and system performance.
Enhanced Customer Experience: The ability to rapidly resolve issues and continuously optimize the system leads to reduced downtime and improved end-user experience.
Informed Decision Making: Consolidated observability tools provide a rich dataset for making strategic decisions regarding architecture improvements and resource allocation, directly influencing the development process and prioritization of features and fixes.
Facilitating DevOps and Agile Practices: A shared visibility into system performance fosters collaboration among teams and supports a culture of continuous improvement, aligning with agile and DevOps methodologies.
The Reference Architecture
The proposed reference architecture for consolidating observability in EDAs encompasses the integration of monitoring, logging, and tracing systems into a unified platform. This platform should offer:
- A centralized single pane of glass for real-time analytics and visualization
- Automated alerting mechanisms based on predefined metrics and patterns
- Seamless integration with development, deployment, and operational processes
- Scalability to accommodate growing data volumes and system complexity
- Support for custom metrics and extensibility to incorporate future tools and technologies
Authors
Stefano Mazzone, Sr. Product Solutions Architect
References
Inspiration and reference documents or existing solutions: