Datadog Network Path
October 28, 2026
Introduction
Users and applications reach the services they depend on over paths that cross hybrid cloud networks no single team owns. A path can span a campus LAN, an SD-WAN overlay, a service provider WAN, the public internet, and a cloud provider’s own network fabric. When performance degrades, each team can show that its own layer is healthy, and the segment actually responsible stays invisible.
This reference architecture is a blueprint for using Datadog Network Path to measure those paths hop by hop. It covers end-user devices, application hosts, site anchors, cloud workloads, and Datadog managed locations. Network Path reports per-hop latency, packet loss, jitter, and path changes over time. It resolves the measured hops against Datadog’s inventory of hosts, network devices, and cloud network resources. This works alongside Cloud Network Monitoring (CNM), Network Device Monitoring (NDM), NetFlow, End User Device Monitoring (EUDM), and Synthetic Monitoring. Together, they give network, cloud, platform, SRE, and IT teams one shared view of network paths across a hybrid cloud network.
This architecture covers:
- Where to place Agents so the paths that matter to the business are measurable
- How to choose between static, dynamic, and Synthetic test types
- How to pick a traceroute variant that gets through firewalls
- How Datadog resolves measured hops, including cloud network resources that never respond to a traceroute
- How to correlate a degraded path with CNM, NDM, NetFlow, EUDM, and log data
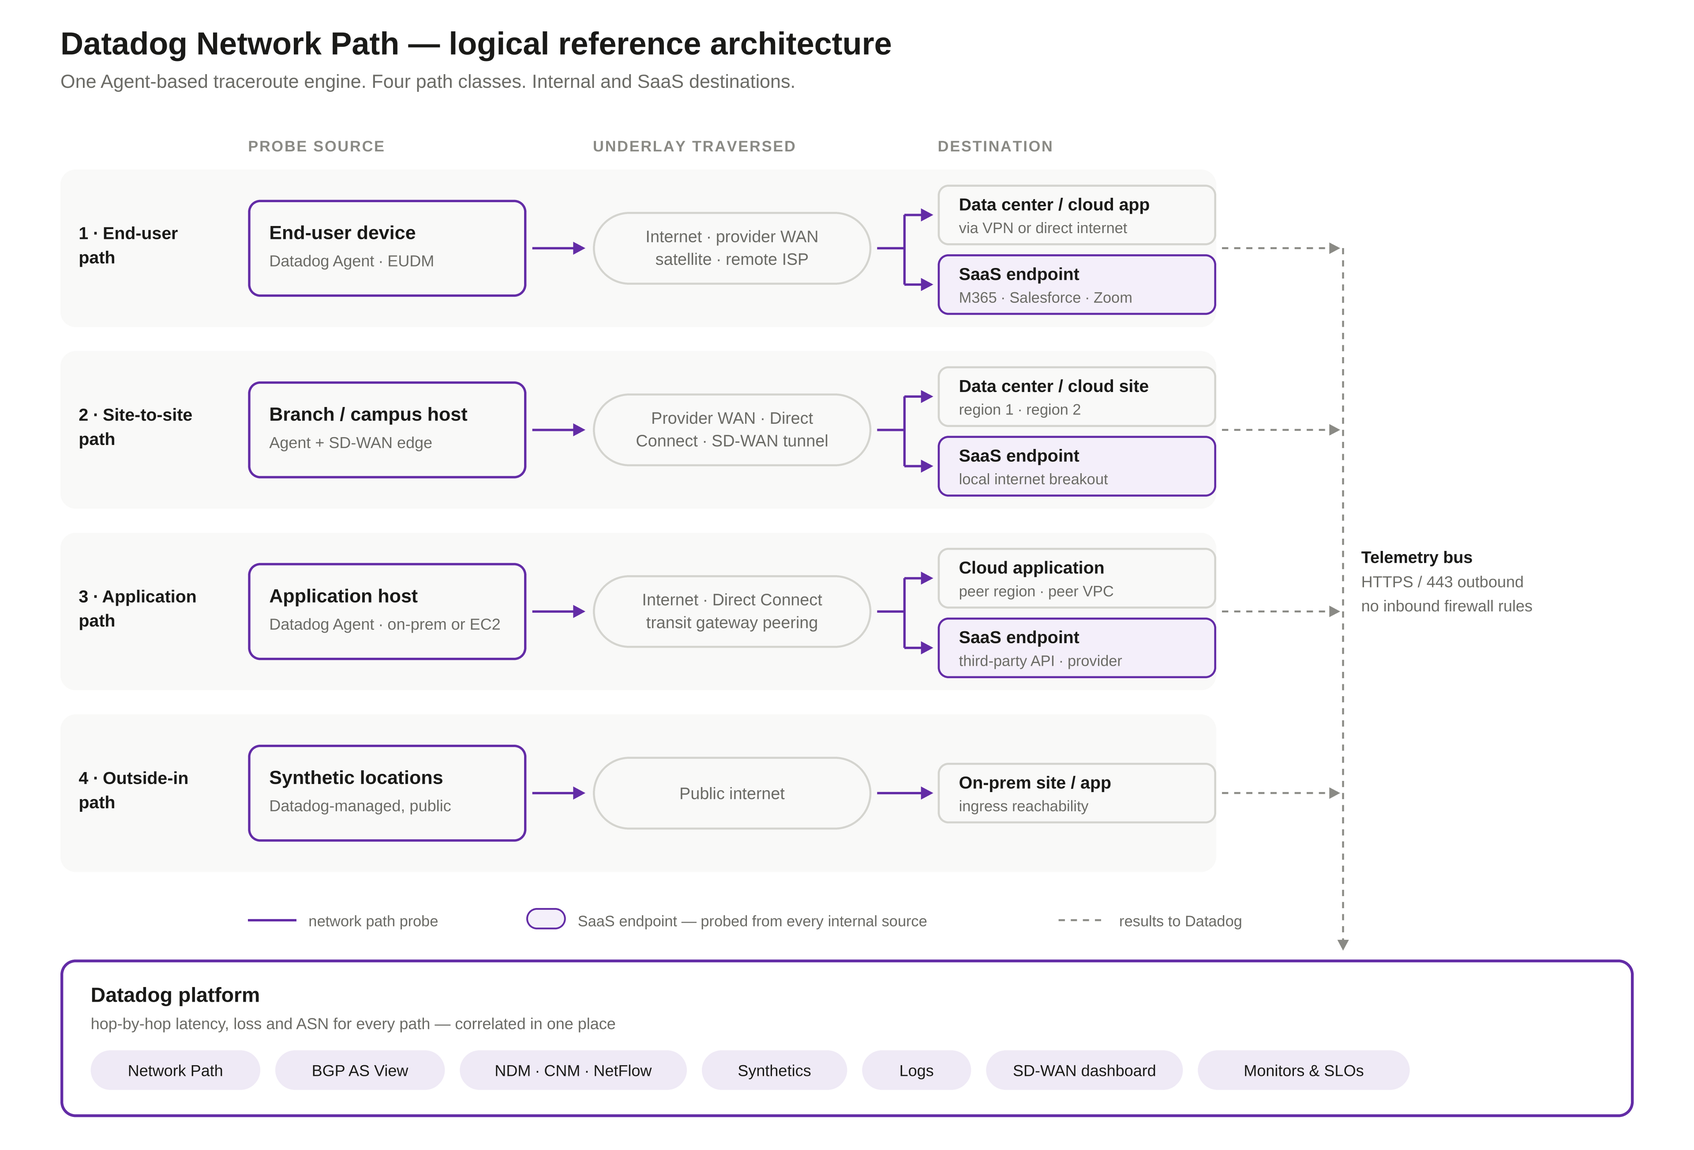
Explanation of the architecture
Network Path runs as a Datadog Agent integration. The Agent performs a traceroute toward a destination, measures each hop, and sends the path to Datadog over HTTPS (port 443). No appliance, collector, or network tap is required, and no dedicated host is needed. Network Path runs on Agents already collecting infrastructure metrics, APM traces, or logs. Because the path is traced from where the Agent runs, Agent placement defines what you can measure.
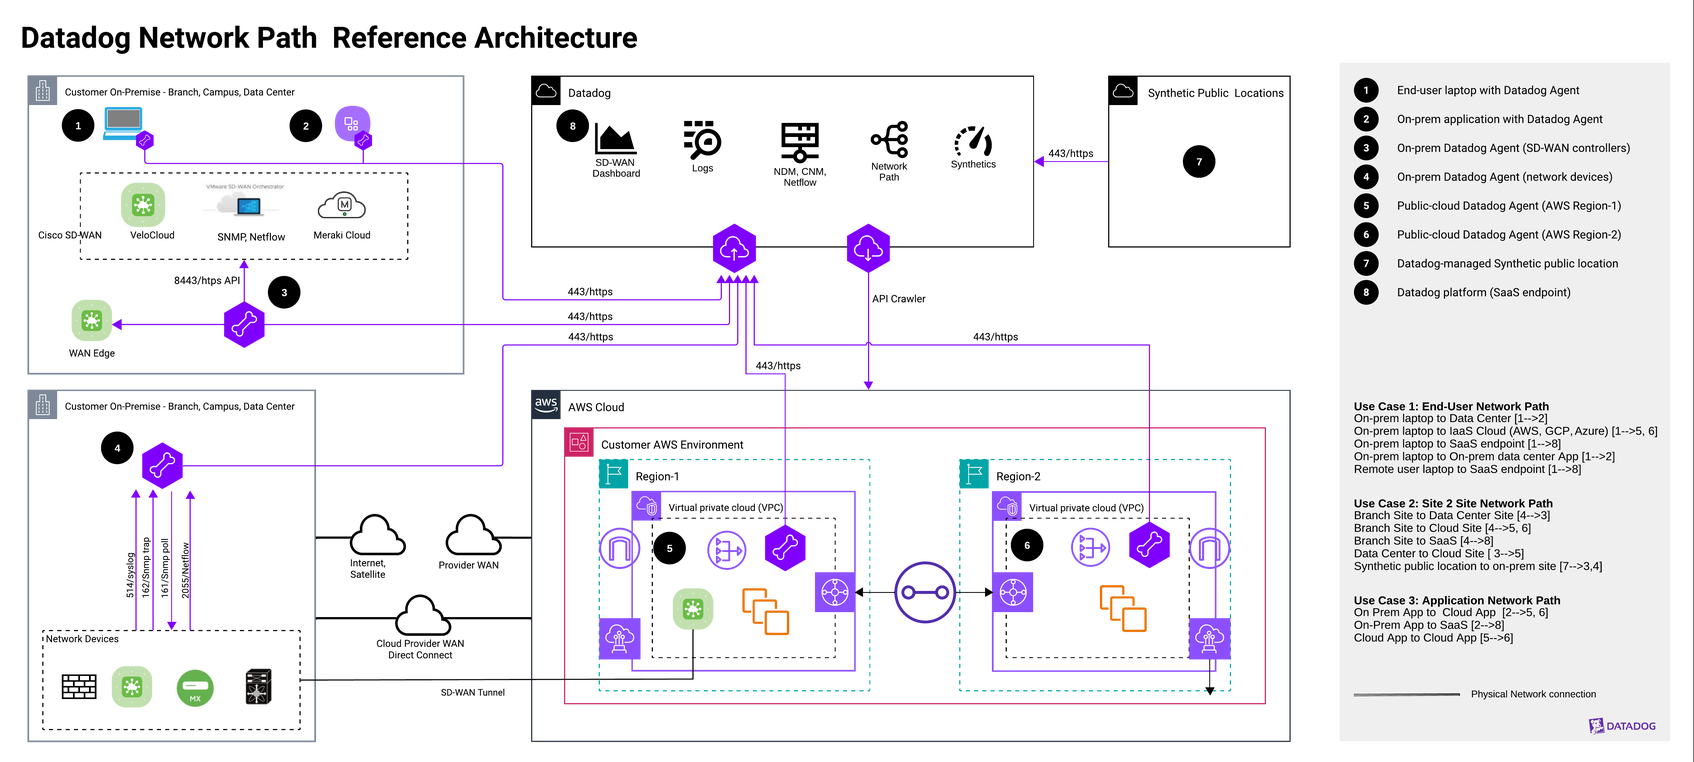
The following steps outline how to plan and configure Network Path monitoring and use the resulting data to investigate network performance.
Step 1
Map the paths that matter to the business, then place Agents at the points those paths start from:
- End-user devices [1]: laptops, desktops, and virtual workstations in branches, campuses, and home offices. These devices provide the only vantage point that reflects real user experience, including Wi-Fi and the last mile.
- Application hosts [2]: bare metal, VMs, and Kubernetes nodes, so paths originate from the workload itself.
- Site anchors [3][4]: a few Agents per branch, campus, or data center for site-to-site measurement. These usually also carry the site’s NDM, NetFlow, and syslog collection.
- Cloud workloads, per region [5][6]: Agents inside each VPC or VNet, which is what makes cross-region and cloud egress paths visible.
- Datadog managed locations [7]: global public locations for external, inbound testing toward your own endpoints, with nothing to deploy.
Scope tests from the problem, not the inventory: which source and destination to test, what SLA is expected between them, and what the impact is when that SLA is missed. Test frequency should follow the criticality of the connection.
Step 2
Network Path tests are directional, and only the source needs an Agent. That is what makes SaaS endpoints, partner APIs, and other networks measurable without their cooperation. One-sided tests are the right default.
Configure tests in both directions, with an Agent at each end, when the return path matters, such as for site-to-site tunnels, hybrid interconnects, and cross-region service traffic. Routing is frequently asymmetric, and a failover that occurs in only one direction is invisible to a single test. When an Agent cannot be placed at the far end, managed locations [7] provide the external inbound view instead.
Step 3
Choose how paths are defined. Static and dynamic tests are complementary, and most deployments use both. (See the Network Path setup documentation for configuration.) The available test types include the following:
- Static (scheduled) tests monitor source and destination pairs you define in the Agent configuration. Use them for known, critical, stable endpoints, such as payment and identity providers, partner APIs, tunnel endpoints, and core internal services. The path is measured on a fixed interval whether or not traffic is flowing, which makes it suitable for baselining, change validation, and alerting with a Network Path monitor.
- Dynamic tests use CNM to discover destinations from traffic the host actually sends, so each CNM flow can have a corresponding path. Use them where the dependency set is large or changing, such as for ephemeral cloud workloads, microservice fan-out, and employee devices reaching dozens of SaaS applications. Include and exclude filters keep traceroute volume proportionate to the value of the paths.
- Dynamic tests for NetFlow trace paths to destination IP addresses seen in NetFlow records, without requiring CNM. This extends coverage to traffic from devices that will never run an Agent. The traceroute runs from the Agent collecting the NetFlow, not the exporter, so place that Agent close to the flow sources.
- Synthetic Network Path tests run TCP, UDP, and ICMP tests from managed locations or from an Agent, with assertions on latency, packet loss, jitter, and hop count. Tests created in either UI appear in both.
A useful pattern is to let dynamic tests do the discovery, then promote the paths that prove important to static tests with their own interval and monitor, and exclude them from dynamic discovery.
Step 4
Choose the traceroute variant. All variants increment TTL and read the ICMP Time Exceeded replies from intermediate routers. However, the variants differ in the types of packets they send, and firewalls treat those packet types differently. Datadog supports ICMP, UDP, TCP SYN, and TCP SACK. (See Network Path traceroute variants for the support matrix and native equivalents.) The variants have the following characteristics:
- ICMP and UDP are the defaults of tracert and traceroute, respectively. Both work well inside networks you control and are commonly filtered at perimeters and on managed endpoints.
- TCP SYN probes a real application port, so it looks like the traffic the path was built to carry and is far more likely to be permitted end to end. It leaves half-open connections, which some security devices treat as a SYN flood or port scan.
- TCP SACK operates after a completed TCP handshake, which gets through firewalls and middleboxes that reject half-open connections. It is the closest match to real application traffic and is supported on Linux.
For anything crossing a firewall or leaving your network, use a TCP variant on the port the application actually uses. On Windows end-user devices, UDP probes are often dropped by policy and the host firewall may block the ICMP replies that reveal intermediate hops. Allow ICMP in policy or run a current Agent, and account for this when planning end-user coverage.
Step 5
Network Path is built on traceroute but does not stop there. Measured hops are resolved into a labeled path topology:
- Node resolution maps hop IP addresses to Datadog hosts and containers, NDM-managed devices, and geolocation and autonomous system data for public addresses. Hop icons reflect the resolved device type, and a resolved device links directly into NDM for its interfaces, metrics, and NetFlow. Reverse DNS recovers names for private IP addresses.
- Cloud resource resolution identifies cloud networking resources that traceroute cannot detect. Managed cloud network services do not decrement TTL or return ICMP, so they never appear as responding hops even though traffic traverses them. Network Path works backward from the source VPC and subnet to the route tables in the cloud resource inventory your cloud integration populates, and determines which service the traffic exited through. In AWS, cloud resource resolution identifies internet gateways, NAT gateways, transit gateways, VPC endpoints, and VPC peering connections.
The path is therefore assembled from measured hops, which show where latency and loss occur, and resolved context, which identifies what those hops are and what sits between them. Configuring the cloud integrations is a prerequisite for a fully labeled cloud path.
Step 6
Correlate the path with the rest of the network and infrastructure telemetry. Because these share the Agent and the tag model, each is a filter away:
- CNM identifies which service-to-service dependency a degraded path carries, with TCP flow, DNS, and cloud network cost breakdowns. It is also the discovery engine behind dynamic paths.
- NDM supplies device health, interface errors and saturation, and SD-WAN orchestrator and WAN edge state for the hops you operate.
- NetFlow supplies the traffic volume and top talkers crossing a suspect hop at the time of the incident.
- EUDM supplies device health, Wi-Fi quality, processes, and crash events, and it traces the path from a user’s device to a SaaS application. Paths can be compared across devices on the same network and across time, which separates a single-user problem from a site-wide one.
- Logs, such as device syslog, SNMP traps, and VPC Flow Logs, explain why a path changed: a BGP reset, an interface flap, or a route or security group change.
A shared tag vocabulary (env, service, site, region, team, device role, circuit) across path tests, devices, and flows enables one filter to retrieve all the related telemetry for the same incident.
Network Path use cases
The use cases below map to the numbered components in the architecture diagram. Component 8, the Datadog platform, also stands in for SaaS destinations: a Network Path test to a Datadog domain such as datadoghq.com measures reachability the same way a test to any other SaaS application would.
End-user network path
Determines whether a user-reported slowdown is because of the device, local network, WAN, internet, or application. Typically served by EUDM with dynamic paths, since a user’s destinations are broad and change constantly. Examples:
- On-premises laptop to data center application [1→2]
- On-premises laptop to IaaS cloud workloads in AWS, Google Cloud, or Azure [1→5, 6]
- On-premises laptop to SaaS endpoint [1→8]
- Remote user laptop to SaaS endpoint [1→8]
Site-to-site network path
Localizes degradation on a circuit, overlay, or interconnect, and establishes whether it is yours or the provider’s. Best served by static paths, and this is where two-sided tests matter most. Examples:
- Branch site to data center site [4→3]
- Branch site to cloud site [4→5, 6]
- Branch site to SaaS [4→8]
- Data center to cloud site [3→5]
- Synthetic public location to an on-premises site [7→3, 4]
Application network path
Identifies which dependency and which hop is responsible when a service is slow and the network is suspected. Usually a blend: dynamic paths for discovered dependencies, static paths for those carrying an SLO. Examples:
- On-premises application to cloud application [2→5, 6]
- On-premises application to SaaS or a third-party API [2→8]
- Cloud application to cloud application [5→6]
Conclusion
Network Path makes measurable the parts of a hybrid cloud network that no single team owns. Static paths hold critical routes to a continuous standard. Dynamic paths cover the dependencies nobody thought to declare, and the right traceroute variant gets a probe through the firewalls in between. Hop resolution turns those measurements into a labeled topology, including the cloud network services that never answer a traceroute. CNM, NDM, NetFlow, EUDM, and logs explain what the degraded hop was carrying and what changed. The result is end-to-end user and application path coverage, faster localization of network degradation, and provider conversations backed by hop-level evidence instead of assumptions.
Get started with Network Path setup.
Authors
Ripin Checker - Senior Product Solutions Architect
References
- Datadog Network Path
- Network Path setup — static, dynamic, and NetFlow paths
- Network Path traceroute variants
- Network Path testing in Synthetic Monitoring
- Network Path monitor
- Datadog Cloud Network Monitoring
- Datadog Network Device Monitoring
- Datadog NetFlow Monitoring
- Datadog End User Device Monitoring
- Hybrid multi-cloud network observability reference architecture