Monitoring Kubernetes with Datadog Distribution of the OpenTelemetry (DDOT) Collector
April 16, 2025
Introduction
Kubernetes is a powerful container orchestration platform that can expose metrics, events, logs, and much more telemetry, both from its core services and from the workloads that run on it. Kubernetes environments benefit substantially from comprehensive observability, as collecting and correlating these telemetry signals allows teams to proactively address performance issues, reduce mean time to resolution, and keep applications running reliably.
It’s straightforward to monitor Kubernetes using the Datadog Agent. Meanwhile, OpenTelemetry (OTel), with its vendor-agnostic approach, has emerged as the go-to standard for generating and managing telemetry data. Until recently, teams faced a difficult choice:
- Use the Datadog Agent for monitoring and instrumentation, but lose some of OTel’s benefits (particularly full, vendor-agnostic flexibility).
- Use a standalone OpenTelemetry Collector for all telemetry and lose access to Datadog’s breadth of differentiating features, such as Fleet Automation, Live Container Monitoring, Cloud Network Monitoring, and more.
- Attempt to run both the Datadog Agent and the OTel Collector on the same node, leading to resource overhead, potential hostname resolution mismatches, and risks of double billing.
To address these challenges, Datadog created the Datadog Distribution of the OpenTelemetry (DDOT) Collector, which runs alongside the Datadog Agent to bring together the benefits of OTel’s flexibility with Datadog’s comprehensive observability solutions. This unified approach enables easy instrumentation and deep Kubernetes monitoring without sacrificing access to Datadog’s advanced features or the agility of OpenTelemetry.
Explanation of the architecture
This reference architecture deploys the Datadog Distribution of the OpenTelemetry (DDOT) Collector as a DaemonSet within a Kubernetes environment (the Agent deployment pattern). The DDOT Collector receives telemetry data (logs, metrics, and traces) from OTel-instrumented applications using the OTLP protocol, processes it, and then sends it to Datadog via the Datadog exporter. Because the DDOT Collector retains its vendor-neutral design, users can also configure additional exporters to forward telemetry data to other destinations, allowing for flexible data processing and routing.
In parallel, the Datadog Agent monitors Kubernetes infrastructure and collects data from any applications instrumented with the Datadog SDK. This combined setup lets teams take advantage of Datadog’s advanced observability features while still adhering to open source principles where desired. The approach is particularly beneficial for users with unique data processing requirements or for those who strongly value the open source extensibility of OpenTelemetry.
Step 1 – Instrumentation
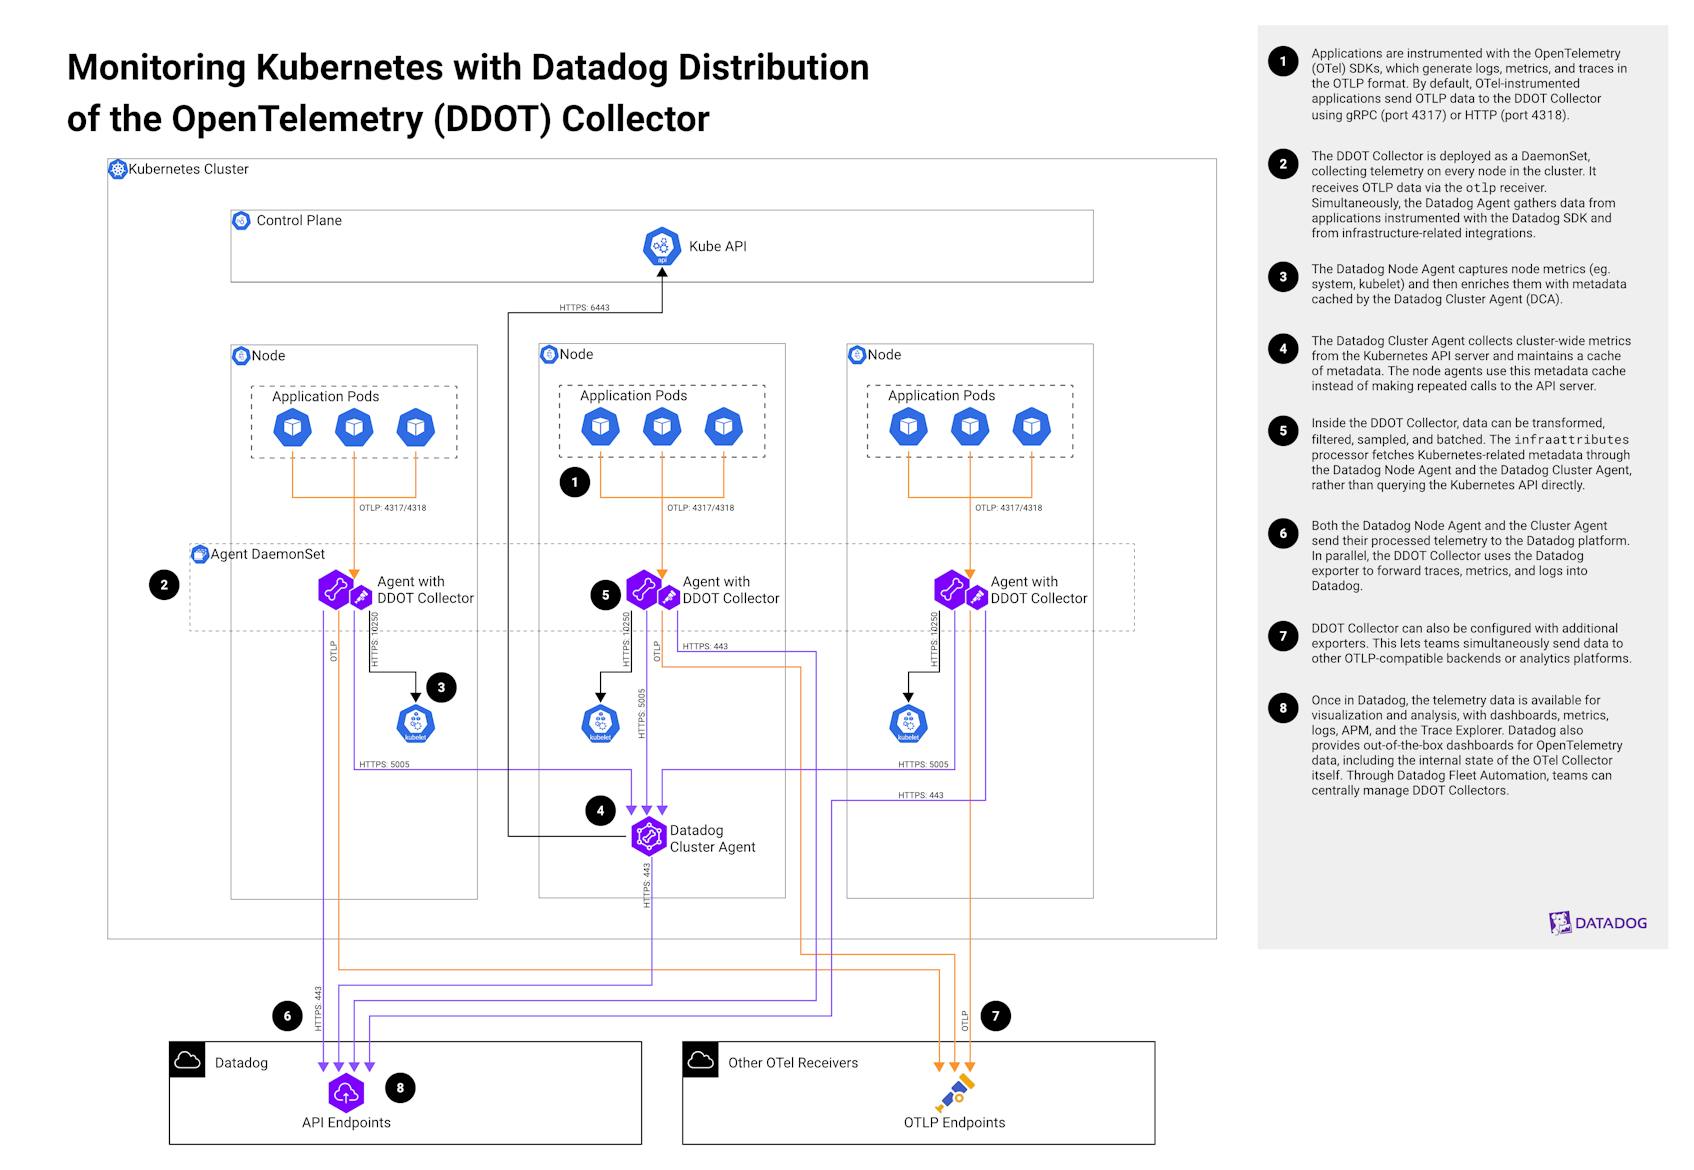
Applications are instrumented with the official OpenTelemetry (OTel) SDKs, which generate logs, metrics, and traces in the OTLP format. Datadog SDKs also support the OTel API, allowing teams to use open-source tooling with Datadog. By default, OTel-instrumented applications send OTLP data to the DDOT Collector using gRPC (port 4317) or HTTP (port 4318). Teams can choose between manual or automatic instrumentation strategies to fit their requirements.
Step 2 – DDOT Collector DaemonSet
The DDOT Collector is deployed as a DaemonSet, collecting telemetry (logs, metrics, traces) on every node in the cluster. It receives OTLP data from applications through the otlp receiver. Simultaneously, the Datadog Agent gathers data from applications instrumented with the Datadog SDK and from infrastructure-related integrations, based on the features enabled.
Step 3 – Datadog Node Agent Processing
The Datadog Node Agent captures node metrics (e.g., system, kubelet) and then enriches them with metadata cached by the Datadog Cluster Agent (DCA). This approach centralizes host-level metrics and ensures consistency in tagging and reporting.
Step 4 – Datadog Cluster Agent Processing
The DCA collects cluster-wide metrics from the Kubernetes API server and maintains a cache of metadata (e.g., pod-to-service mappings). The node agents use this metadata cache instead of making repeated calls to the API server, reducing load and improving efficiency.
Step 5 – DDOT Data Collection and Processing
Inside the DDOT Collector, data can be processed through multiple configurable components for transformation, filtering, sampling, and batching. The infraattributes processor (included in DDOT by default) fetches Kubernetes-related metadata through the Datadog Node Agent and the Datadog Cluster Agent, rather than querying the Kubernetes API directly. This design conserves cluster resources, scales more effectively for large deployments, and provides accurate, consistent tags and attributes for all telemetry data.
Step 6 – DDOT Datadog Exporter
Both the Datadog Node Agent and the Cluster Agent send their processed telemetry to the Datadog platform. In parallel, the DDOT Collector uses the Datadog exporter to forward its enriched telemetry data into Datadog.
Step 7 – DDOT OTLP Exporters
Because DDOT remains compatible with standard OTel components, the Collector can also be configured with additional exporters. This lets you simultaneously send data to other OTLP-compatible backends or analytics platforms for more advanced or niche use cases.
Step 8 – Analysis and Monitoring
Once in Datadog, the telemetry data is available for robust visualization and analysis, with dashboards, metrics, logs, APM, and the Trace Explorer. Datadog also provides out-of-the-box dashboards for OTel data, including the internal state of the OTel Collector itself. Through Datadog Fleet Automation, you can centrally manage your DDOT Collectors and accelerate onboarding with Unified Service Tagging, all backed by Datadog’s enterprise-grade platform.
Proposed solution
The Datadog Distribution of the OpenTelemetry (DDOT) Collector to monitor Kubernetes addresses these challenges by streamlining deployment, simplifying configuration management, and providing robust tools for observing complex, distributed systems. The benefits of the unified solution include:
- Installation via Helm or Datadog Operator. Teams can deploy the Datadog Agent and DDOT Collector with out-of-the-box configurations — complete with curated OTel receivers, processors, and exporters — using the Datadog Helm chart or the Datadog Operator. This setup works immediately while allowing users to adjust or extend configurations for more advanced OTel needs.
- Curated OpenTelemetry components. DDOT comes equipped with preconfigured OTLP data pipelines, reducing complexity for teams that wish to bring OTel telemetry into the Datadog platform. This eliminates the need for separate, siloed deployments.
- Infrastructure Attribute Processor. Rather than calling the Kubernetes API directly (as with the default
k8sattributesprocessor), theinfraattributesprocessor enriches telemetry data with Kubernetes metadata from the Datadog Node Agent and Cluster Agent. This approach avoids potential API overload, scales well for large clusters, and ensures consistent tagging. - Datadog Fleet Automation. For large or distributed Kubernetes deployments, Fleet Automation centralizes visibility and coordination of multiple DDOT Collectors. It streamlines remote configuration changes, ensuring a standardized approach to Kubernetes observability across the organization.
- Flexibility. Because DDOT remains fully compatible with OpenTelemetry, teams can add or replace processors, exporters, and receivers to meet specialized requirements. This ensures that organizations can adapt the default configuration to more intricate use cases without fragmenting their observability stack.
- Seamless Integration with the Datadog Agent. Running DDOT alongside the Datadog Agent enables both OTel-instrumented data and Datadog-native integrations to be collected in the same infrastructure, unifying telemetry flows without the need to maintain multiple, disjoint systems.
Key Benefits
- Full access to Datadog’s platform. From Fleet Automation and Database Monitoring to Cloud Network Monitoring and Live Container Monitoring, you can leverage the entire spectrum of Datadog’s capabilities.
- Vendor-neutral OTel experience. Continue using the OTel APIs and instrumentation you prefer without sacrificing Datadog’s advanced features.
- Efficient, unified deployment. Simplify operations by running the DDOT Collector alongside the Datadog Agent in a complementary way – no more duplicate overhead or conflicting host resolution.
- Enterprise reliability and support. With Datadog’s established SLAs, support channels, and extensive documentation, you can trust that your monitoring infrastructure will scale with your business needs.
- Flexible data routing. Send data to Datadog, other OTLP-compatible endpoints, or multiple destinations simultaneously, all configured within DDOT.
- Reduced complexity. Helm charts and the Datadog Operator provide a simpler installation path, reducing the risk of misconfiguration, and quickly delivering out-of-the-box value.
Authors
Eugene Kirillov, Product Solutions Architect