Monitoring Container Apps - Logs
January 17, 2025
Introduction
Monitoring containerized applications is crucial for managing the health, performance, and availability of modern software deployed in containers. Containers operate in dynamic environments, often on orchestrated platforms like Kubernetes, where applications are composed of multiple, ephemeral microservices. Datadog can collect and centralize stdout/stderr logs for real-time tracking across services, enabling teams to identify issues quickly, improve debugging efficiency, and ensure compliance with auditing requirements.
The Datadog Agent can process and route these logs to a central location, providing powerful search, filtering, and alerting capabilities. By monitoring stdout logs, teams gain comprehensive visibility into containerized environments, ensuring that all application activity, performance trends, and potential errors are effectively managed.
The Datadog Agent delivers real-time insights and supports rich metadata, including Kubernetes pod and namespace details, as well as infrastructure tagging. This allows teams to easily correlate logs with metrics and traces, facilitating full-stack observability and deeper insight across containerized applications.
Explanation of the architecture
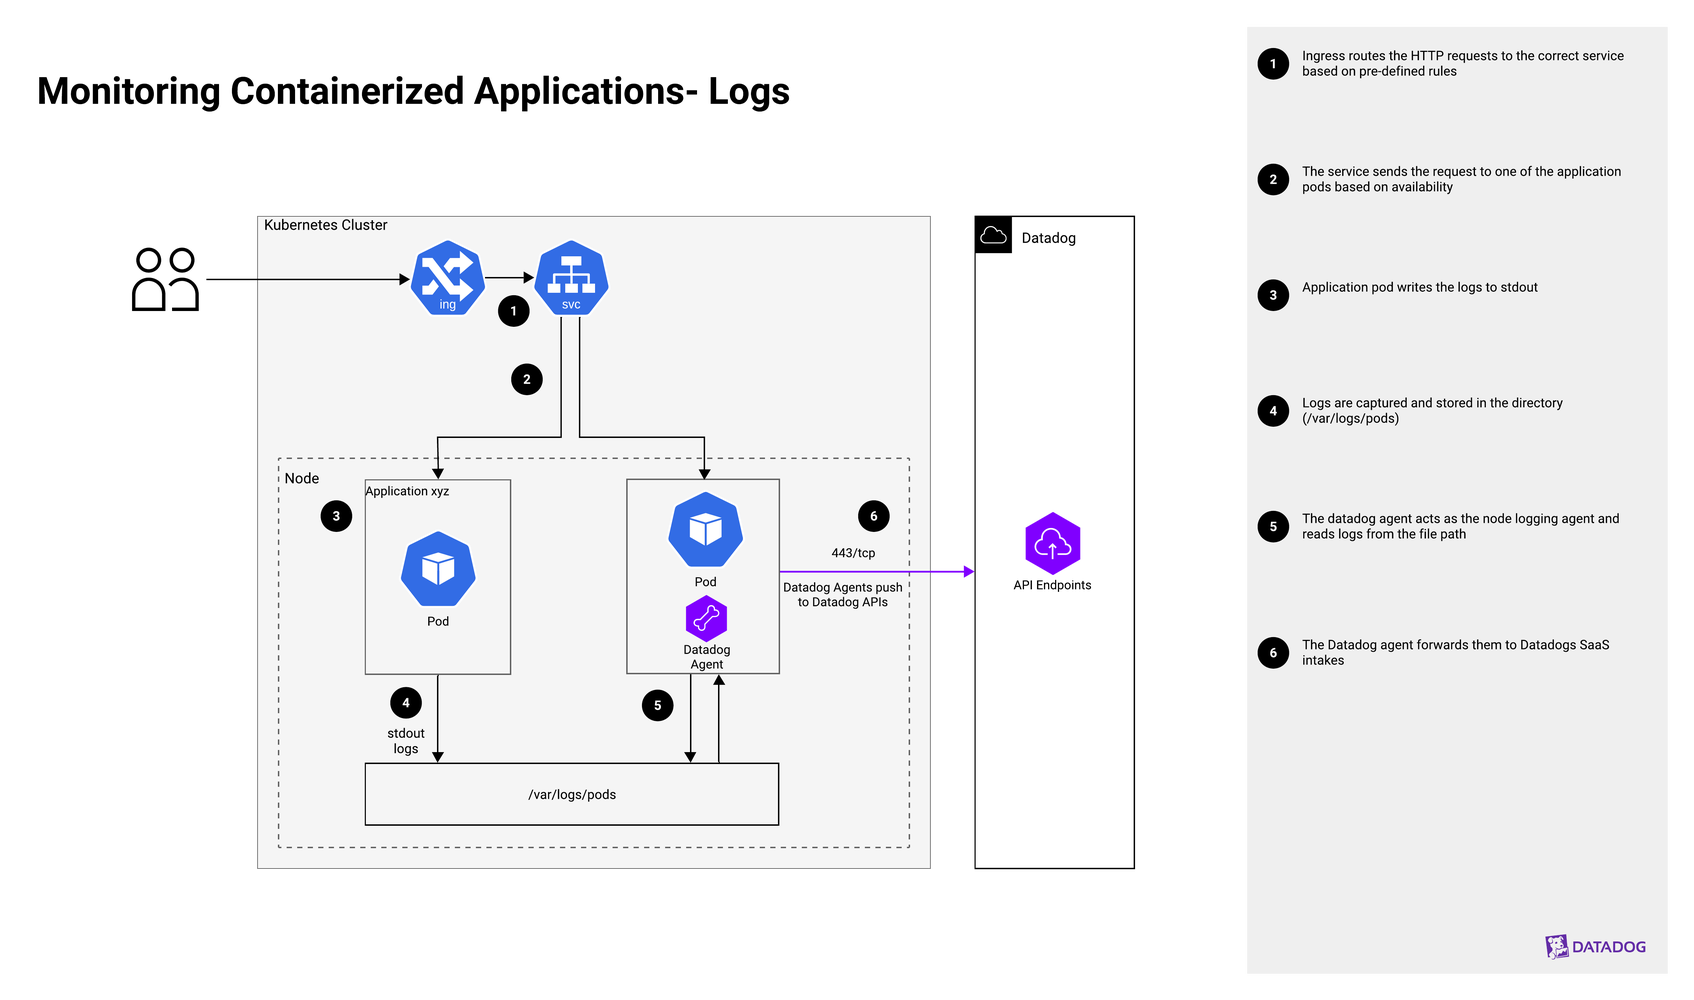
- Step 1
Ingress routes the HTTP requests to the correct service based on predefined rules.
- Step 2
The service sends the request to one of the application pods based on availability.
- Step 3
Application pod writes the logs to stdout.
- Step 4
Logs are captured and stored in the directory (/var/logs/pods).
- Step 5
The Datadog Agent acts as the node logging agent and reads logs from the file path.
- Step 6
The Datadog Agent forwards logs to Datadog SaaS intakes and makes them available for immediate search, visualization, and alerting. See here for intake details.
- Step 7
The Datadog platform offers capabilities that allow for automatic parsing of JSON logs, processing of unstructured logs with 200+ OOTB integration pipelines or custom pipelines, sensitive data redaction, Error Tracking, Watchdog Insights for automated anomaly detection, Cloud SIEM, logs-to-metrics, search and analytics, and the ability to monitor and alert on your logs.
Authors
Emily Marshall, Product Solutions Architect