GPU Monitoring Reference Architecture
January 6, 2026
Introduction
Datadog’s GPU Monitoring offering aims to address the growing demand for enhanced GPU observability, driven by significant AI/ML workload scale across hundreds of GPU-interconnected accelerated computing infrastructures. This observability solution reference architecture enables DevOps, ML engineers, and infrastructure site reliability engineers to optimize GPU utilization, performance, and cost efficiency by integrating core GPU monitoring capabilities into existing Datadog infrastructure monitoring products along with full-stack observability.
Modern AI/ML stacks are GPU-bound. Blind spots around GPU utilization, memory headroom, and multi-instance GPU partitioning cause training slowdowns, out-of-memory events (OOMs), and flaky inference latency. This reference architecture defines a consistent way to:
- Collect device metrics (utilization, memory, thermals, error-correcting code (ECC), power)
- Correlate GPU metrics with workload context (pod/job, model, dataset, team)
- Alert on saturation and failures
- Trend capacity and cost efficiency
Explanation of the architecture
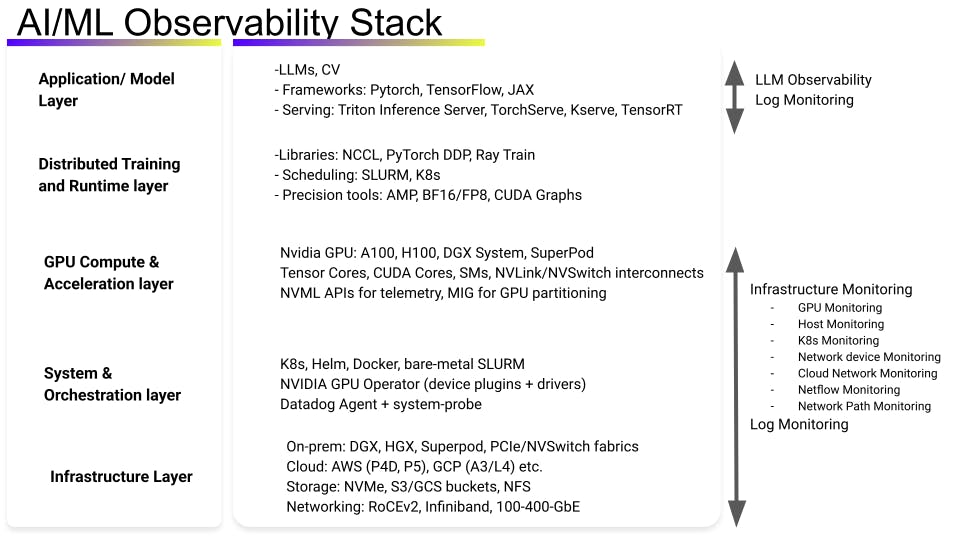
This GPU Monitoring reference architecture provides guidance for AI/ML workloads on Kubernetes containers that run on a NVIDIA GPU. For a holistic view of Datadog observability for the AI/ML technology stack, refer to the overview diagram below.
Key considerations for this architecture:
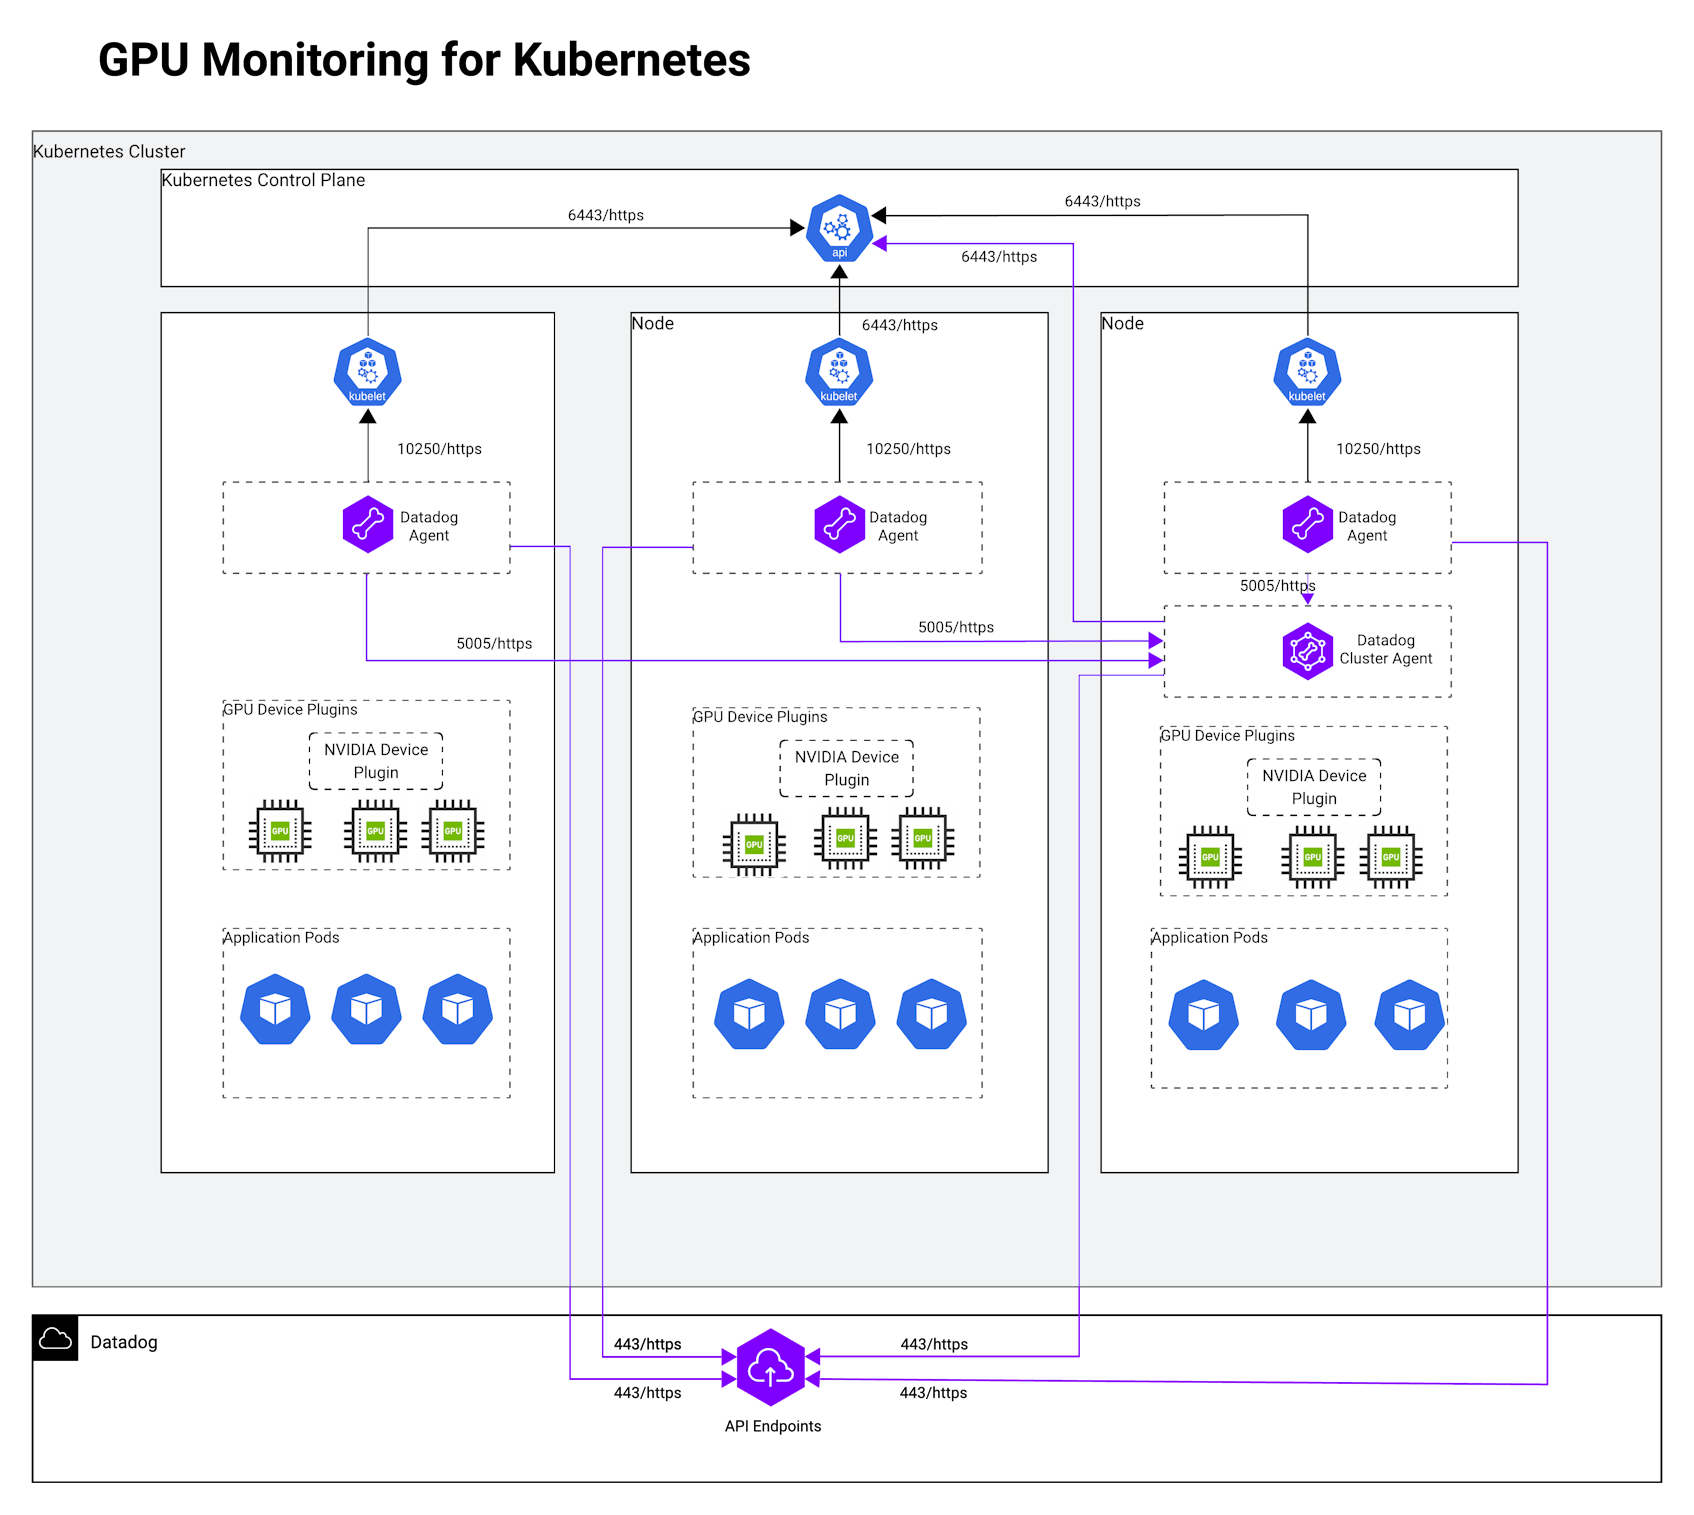
- Prerequisites for GPU monitoring are provided in our GPU Monitoring documentation. One important requirement is to have the NVIDIA device plugin for Kubernetes installed directly or through the NVIDIA GPU operator. The GPU operator is essential to discover GPU nodes, install NVIDIA drivers on GPU nodes and install the NVIDIA container toolkit/runtime. This enables the GPU resources to be schedulable and usable by the Kubernetes pods.
- See our documentation for minimum versions and platform requirements.
- Deployment model 1: Uniform Kubernetes clusters (all nodes have GPUs)
- See our documentation for instructions for setting up GPU Monitoring on a uniform cluster or non-Kubernetes environment.
- Deployment model 2: Mixed Kubernetes clusters (some nodes have GPUs and some don’t)
- See our documentation for instructions for setting up GPU Monitoring on a mixed cluster. For this deployment model, it is crucial to split the agent: one config for non-GPU nodes and one for GPU nodes (Operator AgentProfiles or two Helm releases). It is recommended to use the Datadog Operator model.
- To collect fine-grained, spatially distributed GPU core activity data metrics, the system-probe and privileged mode must be enabled. For per-process/POD attribution, system-probe is not needed. System-probe-based enhanced GPU metrics requires Linux with a modern kernel and grants system-probe the permissions to read
cgroupand GPU device info. Google Kubernetes Engine (GKE) also needs acgrouppermission helper toggle. - Public cloud specifics:
- For GKE, you will have to flip the cgroup-permission helper (Operator: patch Cgroup Permissions; Helm: configureCgroupPerms) so system-probe can read GPU device cgroups.
- For Amazon Elastic Kubernetes Service (EKS) and Oracle Cloud, the typical approach is to set runtimeClassName to empty; the default runtime already exposes GPUs. Azure AKS is currently on the roadmap.
Quick checklist
- NVIDIA device plugin (or GPU Operator) is installed in the cluster.
- Agent/Operator/Helm versions meet minimums; Linux; NVIDIA driver ≥ 450.51; K8s ≥ 1.22.
- Uniform cluster: Enable
features.gpu.enabled(Operator) ordatadog.gpuMonitoring.enabled(Helm) + runtime class. - Mixed cluster: Operator Agent Profiles or two Helm releases with
nodeAffinitysplit. - GKE special case: Enable
cgrouppermission helper.
Datadog’s GPU Monitoring Metrics
Datadog’s GPU Monitoring metrics enables teams to understand GPU fleet utilization, workload efficiency, thermal and power behavior, and interconnect performance. This drives higher GPU ROI and operational reliability.
- Key metrics such as
gpu.sm_active,gpu.process.sm_active, andgpu.process.memory.usagereveal compute and memory utilization at both device and process levels — helping MLOps and data science teams detect idle or “zombie” allocations, optimize batch sizes, and validate training efficiency. - Memory and power metrics (
gpu.memory.free,gpu.power.usage,gpu.power.management_limit) highlight saturation, throttling, or power capping conditions that impact performance. - Thermal and health signals (
gpu.temperature,gpu.fan_speed,gpu.clock.throttle_reasons.*,gpu.errors.xid.total,gpu.remapped_rows.*) support infrastructure SREs in preventing overheating or driver-level faults. - Network engineers can monitor distributed training health with
gpu.nvlink.throughput.data.{rx,tx},gpu.nvlink.errors.*, andgpu.pci.throughput.{rx,tx}to detect interconnect bottlenecks. - For Hopper-class GPUs, advanced pipeline metrics (
gpu.fp16_active,gpu.tensor_active,gpu.integer_active,gpu.sm_occupancy) expose mixed-precision and kernel efficiency insights.
Together, these GPU metrics provide per-pod and per-device attribution, enabling anomaly detection, cost chargeback, and fine-grained performance tuning across inference and training environments without requiring privileged mode except for spatial SM/core analysis via system-probe.
Conclusion:
Datadog’s GPU Monitoring reference architecture enables organizations to operate a reliable, performant, and cost-efficient accelerated computing infrastructure. By unifying GPU telemetry with container, process, and application context, it delivers full-stack observability across AI, ML, and HPC workloads—spanning from device health and resource utilization to workload behavior and interconnect performance. This architecture empowers platform, SRE, and MLOps teams to detect inefficiencies, prevent hardware and scheduling failures, and optimize capacity in real time. The result is an observability-driven operating model where GPU resources are continuously measured, protected, and tuned—ensuring consistent model performance, predictable scaling, and sustainable infrastructure efficiency across training and inference environments.
Authors
Ripin Checker, Senior Product Solutions Architect
References
GPU Monitoring setup documentation
Datadog GPU Monitoring blog