Enhancing Application Observability in AWS Lambda with Datadog and OpenTelemetry
January 26, 2026
Introduction
AWS Lambda is a serverless compute service that executes code in response to events and automatically manages the underlying resources. It’s one of AWS’s most popular services, and it works especially well for running a large number of small- to medium-scale tasks in a function-as-a-service (FaaS) model.
Because Lambda is so widely used in production, it’s critical to ensure proper observability for this service. This means monitoring not only infrastructure metrics but also the performance of application code that runs inside your Lambda functions.
Monitoring AWS Lambda in this way requires an approach that fits naturally with the Lambda ecosystem. Fortunately, Lambda includes a handy feature called the Lambda Extension Layer, which allows you to run binaries during the function’s life cycle. By using this extension, you can collect telemetry signals from the code running inside your functions. Both Datadog (with the Datadog Lambda Extension) and OpenTelemetry (with the OpenTelemetry Lambda Layers, the industry standard for telemetry collection) provide ready-to-use solutions for this purpose.
In this post, we’ll look at the different options and best practices for monitoring Lambda applications, with a focus on application-level tracing using Datadog APM, the Lambda Extension, and OpenTelemetry (OTel).
Instrumenting Lambda APM with Lambda Extensions
As mentioned earlier, the key to enabling Datadog APM in AWS Lambda is the Extension Layer.
When you use either Datadog’s official extension or the open source OTel extension for Lambda, there are four main patterns you can follow. The fourth is a special case, shared here as a tip to show that this type of design is also possible.
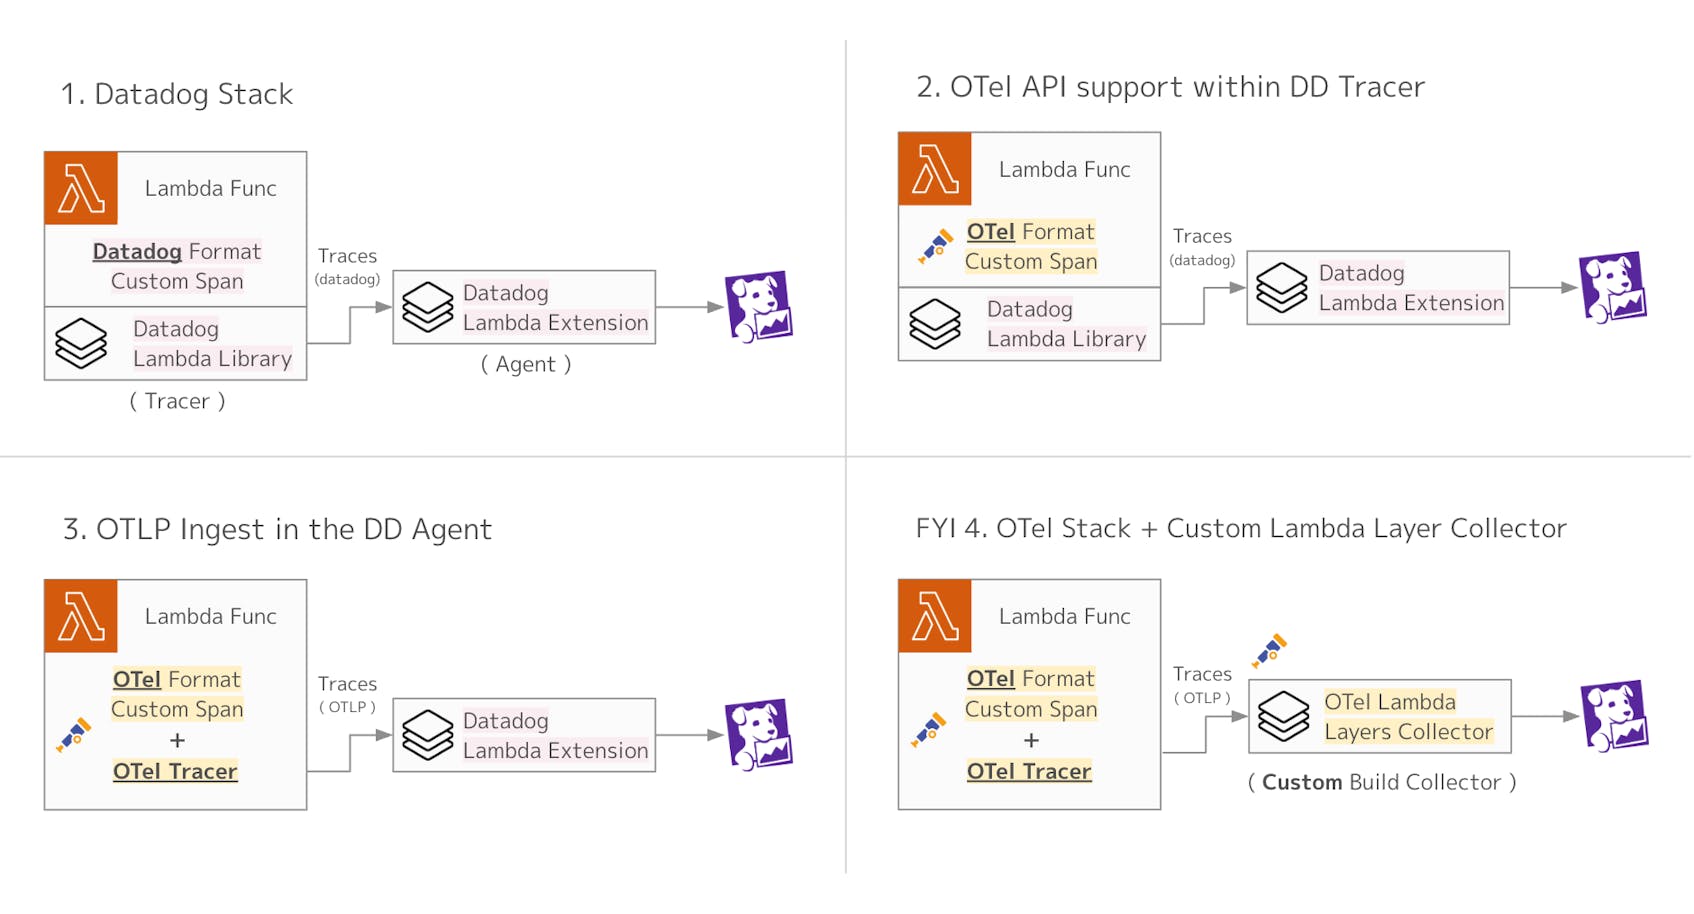
When instrumenting Lambda to send traces to Datadog APM, there are two main preparations required:
- Tracer setup, so you can generate spans
- Agent setup, to send those spans to Datadog
In addition, by creating custom spans directly within your Lambda code, you can identify which parts of the process become bottlenecks. You can also add business-critical tags to your trace data, which makes it easier to analyze this telemetry in Datadog.
The following sections will explain the different setup patterns, either using Datadog directly or using OpenTelemetry.
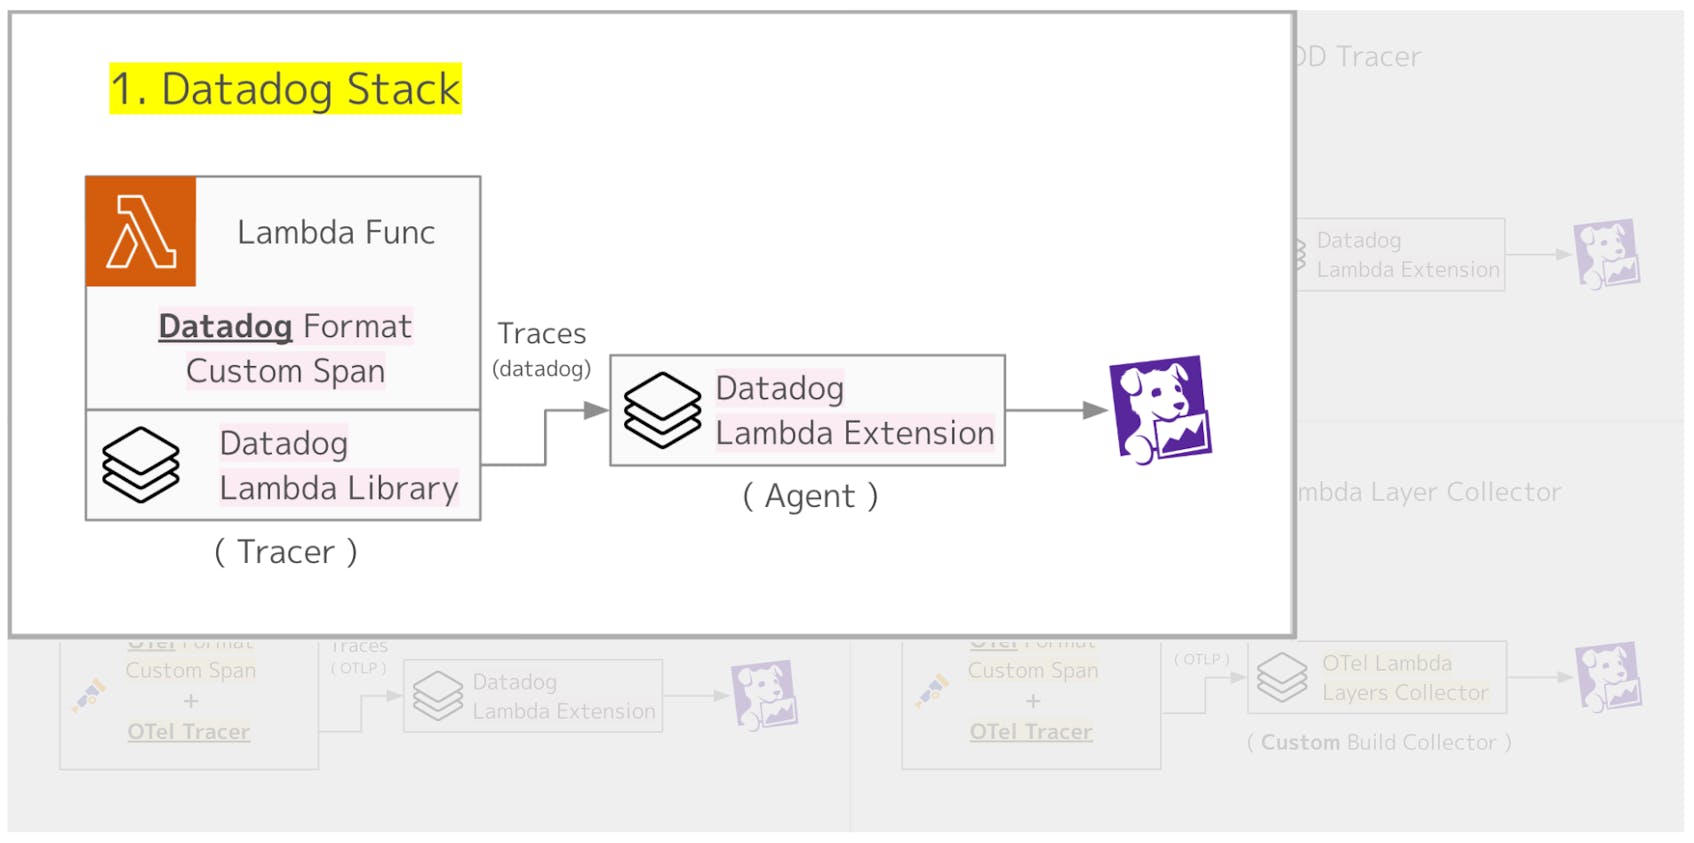
1. Datadog stack
In this pattern, both the tracer and the agent setup are handled through the Datadog Lambda Extension. The Datadog Lambda Extension supports a wide range of runtimes, and it can be introduced using various methods such as the Datadog CLI, AWS SAM, AWS CDK, or Terraform.
Once the setup is complete, you can immediately start instrumenting your Lambda functions with APM.
Creating custom spans is also straightforward. You can use the dd-trace library provided by Datadog, and all it takes is adding a few lines to your Lambda code, as shown below.
 1import time
 2from ddtrace import tracer
 3
 4def lambda_handler(event, context):
 5    current_span = tracer.current_span()
 6    if current_span:
 7        current_span.set_tag('customer.id', '123456')
 8
 9    with tracer.trace("hello.world"):
10        print('Hello, World!')
11    # ...
Datadog provides serverless monitoring as part of its platform, making it very easy to set up and monitor AWS Lambda functions. If you are already using Datadog as your observability tool, we recommend setting up Lambda through the Datadog stack for the smoothest experience.
2. OTel API support within Datadog Tracer
Pattern 2 uses OTel for custom instrumentation. The Datadog tracer supports the OTel API, which means it can receive spans created with the OTel SDK and forward them to the Datadog Agent.
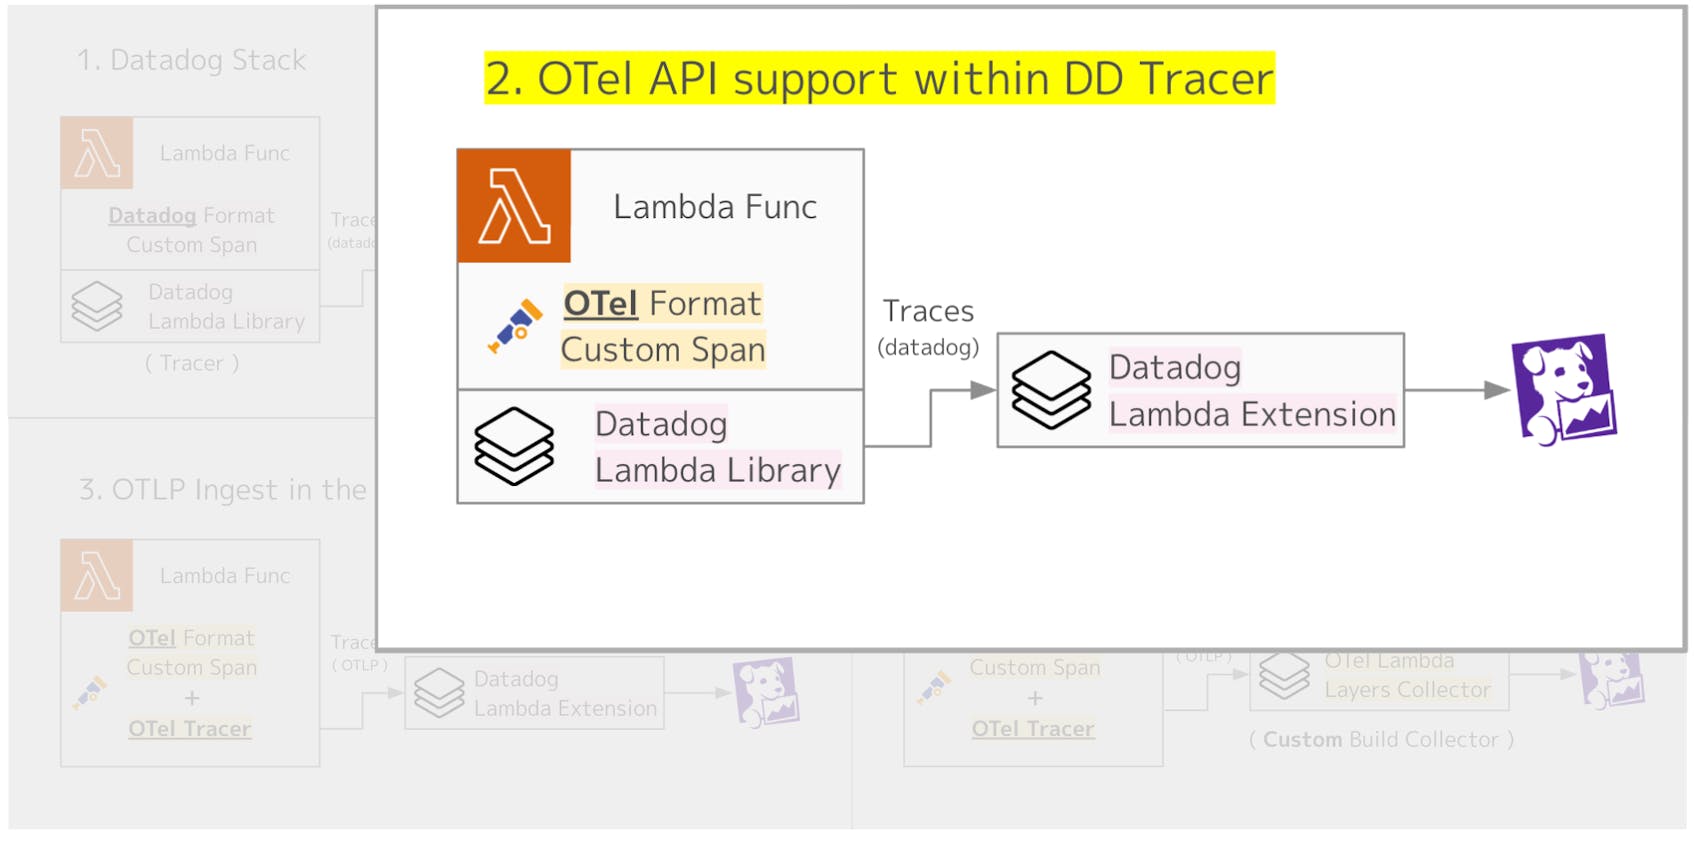
The setup for Lambda Extension Layers is the same as in Pattern 1. When generating spans with OTel, you simply add code like the following inside your Lambda function.
1from opentelemetry import trace
2
3tracer = trace.get_tracer(__name__)
4
5def lambda_handler(event, context):
6    # Add a custom span with OpenTelemetry
7    with tracer.start_as_current_span("hello.world"):
8        print('Hello, World!')
9    # ... further handler logic
To enable this setup, you need to set the environment variable DD_TRACE_OTEL_ENABLED to true. With this configuration, custom instrumentation is handled by OTel, while the tracer and agent are provided by the Datadog Lambda Extension.
Custom instrumentation, such as adding spans or attaching domain-specific parameters as tags, plays a critical role in improving application observability. If you rely solely on vendor-specific libraries for this setup, you risk vendor lock-in. By using OpenTelemetry, you can instrument your application based on open standards and send telemetry data to any tool that supports the OTel specification.
This approach allows you to standardize complex custom instrumentation with OTel, while still relying on Datadog’s vendor-specific setup for the tracer and agent. This combination offers flexibility and reduces lock-in, while still taking advantage of Datadog’s integration.
Datadog recommends this pattern as the preferred way to set up Lambda monitoring with OTel.
3. OTLP ingest in the Datadog Agent
Pattern 3 takes the idea a step further by using OTel for both tracer setup and custom instrumentation, making the entire Lambda function fully aligned with the OpenTelemetry standard. In this case, only the agent part relies on the Datadog Lambda Extension, where the Datadog Agent receives trace data via the OpenTelemetry Protocol (OTLP).
Compared to Pattern 2, this approach brings the application even closer to a pure OTel setup.
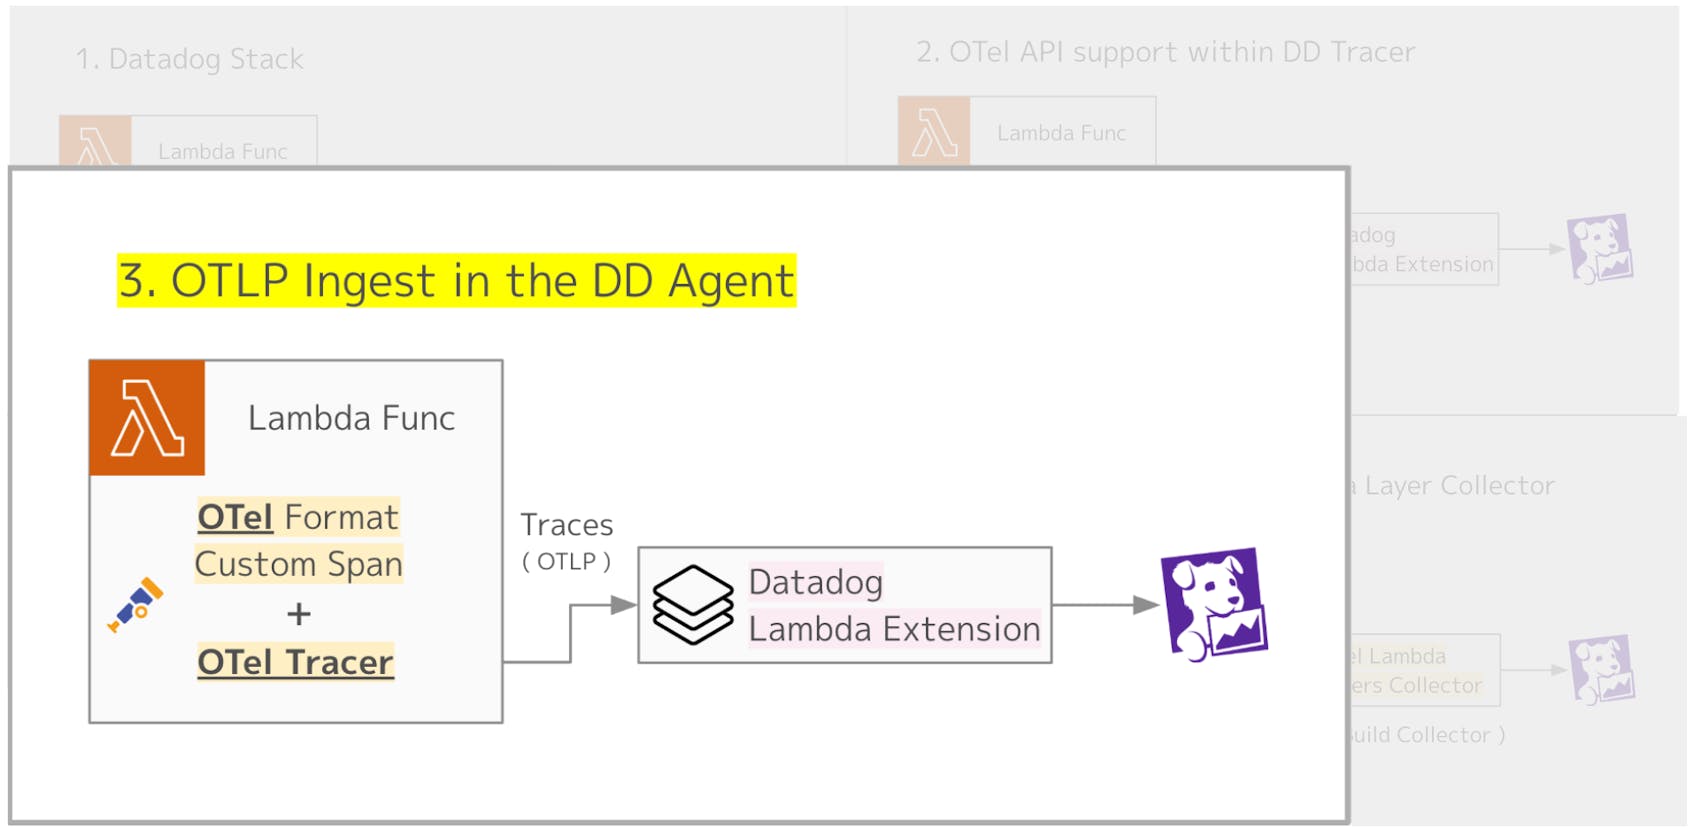
On the Datadog Agent side, the Lambda Extension Layer listens on an OTLP port. Therefore, you need to set DD_OTLP_CONFIG_RECEIVER_PROTOCOLS_HTTP_ENDPOINT (or DD_OTLP_CONFIG_RECEIVER_PROTOCOLS_GRPC_ENDPOINT) to localhost:4318 (or localhost:4317).
The tracer setup is handled directly in your application code.
 1from opentelemetry.instrumentation.aws_lambda import AwsLambdaInstrumentor
 2from opentelemetry import trace
 3from opentelemetry.sdk.trace import TracerProvider
 4from opentelmetry.exporter.otlp.trace_exporter import OTLPExporter
 5from opentelmetry.sdk.trace.export import SimpleSpanProcessor
 6from opentelemetry.resource import Resource
 7from opentelemetry.semconv.resource import (
 8    SERVICE_NAME,
 9    SemanticResourceAttributes,
10)
11
12# Create and configure a TracerProvider
13tracer_provider = TracerProvider(resource=Resource.create({SERVICE_NAME: <YOUR_SERVICE_NAME>}))
14
15# Add a span processor with an OTLP exporter for traces
16tracer_provider.add_span_processor(
17    SimpleSpanProcessor(
18        OTLPExporter(endpoint="http://localhost:4318/v1/traces")
19    )
20)
21
22# Register the configured provider
23trace.set_tracer_provider(tracer_provider)
24
25# Instrument the AWS SDK and AWS Lambda
26AwsLambdaInstrumentor().instrument(tracer_provider=tracer_provider)
Therefore, unlike Patterns 1 and 2, you should not add a Lambda Extension Layer for tracer setup when using this approach.
As of the time of writing (January 2026), this setup is still in Preview. If you plan to use OTel for custom instrumentation in your applications, Pattern 2 is the recommended approach to consider.
4. OTel Stack + custom Lambda Layers Collector (FYI)
Pattern 4 sets up the entire Lambda side using OTel and sends trace data directly to Datadog. Please note that this approach is not officially supported by Datadog. It is introduced here only from a technical feasibility perspective.
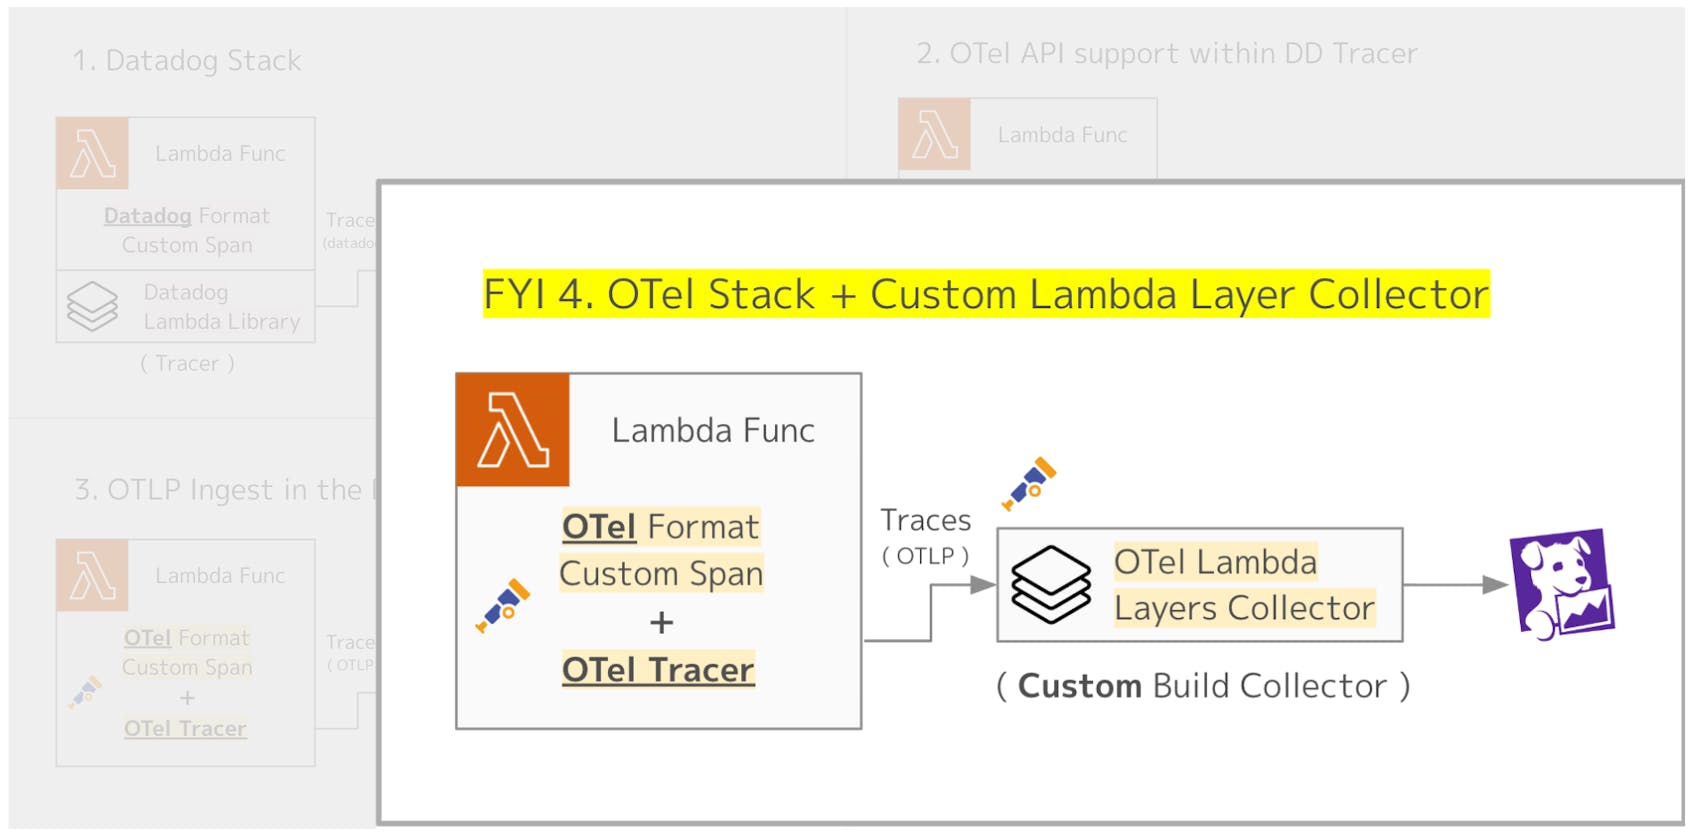
As mentioned earlier, OpenTelemetry also provides an agent-side Lambda Extension Layer (the OTel Collector AWS Lambda Extension Layer). In practice, this runs the OTel Collector binary inside the Extension Layer. With this setup, it may appear possible to receive traces from your Lambda code over OTLP and then forward them from the OTel Collector to Datadog.
However, the default OTel Collector does not include the Datadog Exporter. If you want to add this component, you need to follow the instructions in “Build your OpenTelemetry Collector Lambda layer from scratch” to create a Custom Build Collector, and then set it up as a Lambda Extension Layer.
Building a Custom Collector is described in the README, and the process is not particularly difficult. Below is a quick outline of the steps.
- Add the component you want to include (the Datadog Exporter, in this example) to your
go.moddependencies:
require github.com/open-telemetry/opentelemetry-collector-contrib/exporter/datadogexporter v0.132.0
- Add the Datadog Exporter to
default.go:
 1import "github.com/open-telemetry/opentelemetry-collector-contrib/exporter/datadogexporter"
 2
 3func Components() (otelcol.Factories, error) {
 4    return otelcol.MakeFactoryMap(
 5        // ...
 6        []otelcol.ExporterFactory{
 7            datadogexporter.NewFactory(), // added
 8            // ...
 9        },
10        // ...
11    ), nil
12}
- Build the layer:
$ make publish-layer
By running make, the OpenTelemetry Collector Lambda layer is built and added to your AWS account as a Lambda Layer. Using this approach, you can set up the OTel Collector with the Datadog Exporter included, and send trace data from your Lambda functions to Datadog.
Admittedly, this requires some extra effort. However, this method can be useful if you need to send trace data to multiple observability tools or if you want the flexibility to switch observability platforms depending on the environment.
A more practical approach to Pattern 4
In this post, the main focus has been on using the Lambda Extension Layer for instrumentation. However, a more practical and widely adopted approach is to instrument your Lambda functions with OTel, while running the OTel Collector in a non-Lambda environment, which is redundant and highly available. This setup is often referred to as the gateway pattern and is explained in detail in our blog post on OTel deployment patterns.
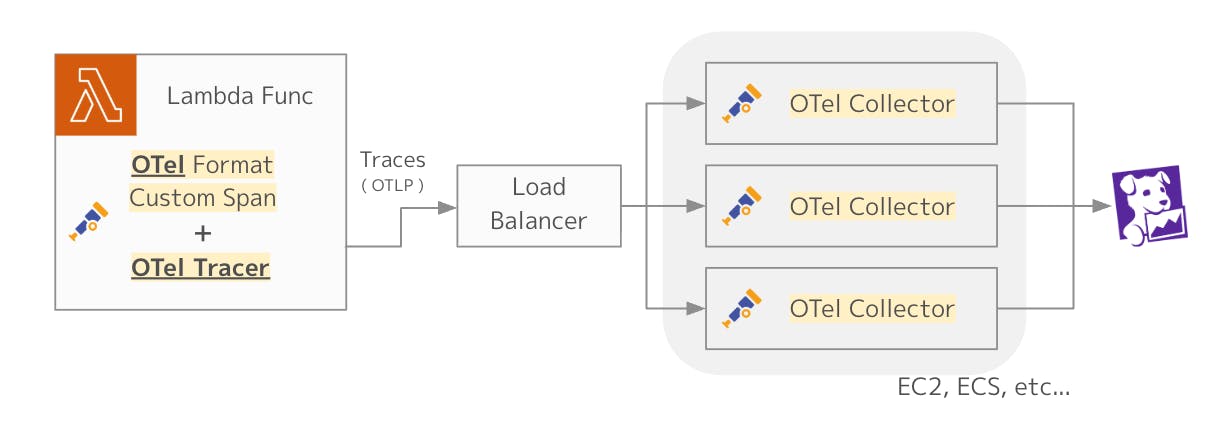
With this approach, the instrumentation inside Lambda relies solely on OTel, while the gateway pattern provides several additional benefits that make it a more common and production-ready architecture:
- Stability: The OTel Collector runs as a long-lived service, independent of the Lambda lifecycle.
- Efficiency: There is no need to start an OTel Collector with every Lambda invocation, avoiding unnecessary overhead.
- Centralized management: Telemetry from multiple Lambdas and other services can be aggregated in one place, where buffering, sampling, and routing policies can be applied consistently.
If you want to learn more about the gateway pattern, it’s also worth reviewing the official documentation.
Conclusion
In this post, we explored several ways to instrument AWS Lambda, one of the most popular FaaS platforms, to send application traces to Datadog APM, while also highlighting OTel, the de facto standard for telemetry collection in observability.
Each organization will need to choose the approach that best fits its needs. I hope this post serves as a helpful guide in making that decision!
Authors
Keisuke Sakasai Sales Engineer, Datadog