Application Profiling | Datadog

Application Profiling

Continuously profiler your applications to optimize code performance in production, at any scale, all the time.

Continous application profiling helps you analyze and compare code performance at any time and in any environment, including production, with negligible overhead. Proactively analyze and optimize your application code in order to improve MTTR, enhance user experience, and reduce cloud provider costs with the Continuous Profiler.


Deploy continuous application profiling

Improve service performance with always on application profiling.
  • Gain full visibility into the performance of your application code in production, with minimal overhead and at all times
  • Quickly find the most time-consuming parts of your code with a breakdown of application profiling data for every distributed request
  • Optimize your application’s code and user experience by analyzing wall time, lock, socket I/O, and file I/O code profiles

Proactively profile application performance

Optimize CPU utilization, improve memory allocation, and save on compute costs
  • Reduce cloud costs by detecting and optimizing the methods in your production code that consume the most CPU and memory
  • Leverage CPU and memory profile aggregation across hosts, services, and code versions to optimize the resource consumption in production
  • Track CPU and memory consumption by method over time and compare application profiles to quickly explain performance regressions after code deployments

Get complete visibility into code-level performance

Put profiling data in context to gain a deeper understanding of your application performance.
  • Analyze 100% of your code in production including methods, classes, and threads across your entire stack
  • Seamlessly pivot between data from application profiling and distributed tracing with 1-click to identify the most resource-intensive requests
  • Get deeper insights into exceptions, garbage collection, I/O, locks, and packages with continuous observability and category breakdowns such as code cache, class loading, and heap size

The Essential Monitoring and Security Platform for the Cloud Age

Datadog brings together end-to-end traces, metrics, and logs to make your applications, infrastructure, and third-party services entirely observable.

platform_diagram_lpg

Leverage Next Generation Application Profiling Tools

Proactively profile your code to quickly troubleshoot application performance.
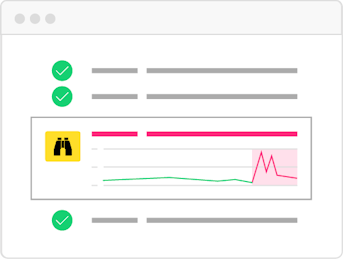
watchdog-apm-illustration.png

Watchdog

Auto-detect and surface performance problems without manual alert configuration.
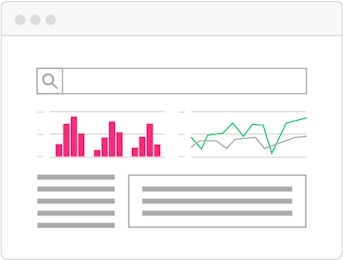
tracesearch-apm-illustrationv2.png

App Analytics

Search, filter, and analyze stack traces at infinite cardinality.
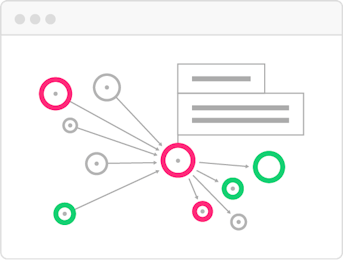
servicemap-apm-illustration.png

Root Cause Analysis

Full stack correlation from synthetic tests to metrics, traces, and logs.

Application Profiling Resources

Learn about application profiling with the Datadog Continuous Profiler.

Datadog Application Profiling Starter Kit

Loved & Trusted by Thousands

Washington Post logo 21st Century Fox Home Entertainment logo Peloton logo Samsung logo Comcast logo Nginx logo