Unify real-time infrastructure data, logs, and metrics in one cloud monitoring platform
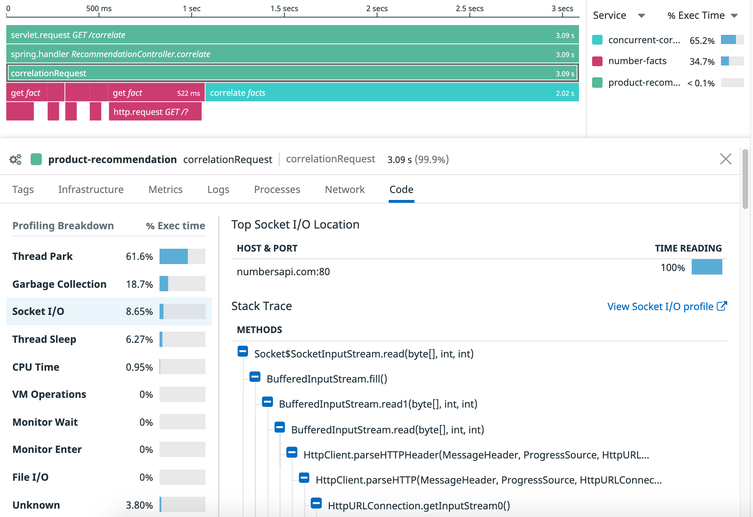
Visualize metrics, trace, logs and more in one place.
Optimize your Systems with end-to-end cloud monitoring
See inside any stack, any app, at any scale, anywhere in one cloud observability platform
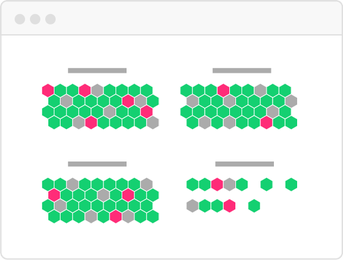
Host and Container Maps
Visualize the status of your servers or containers in a single view.
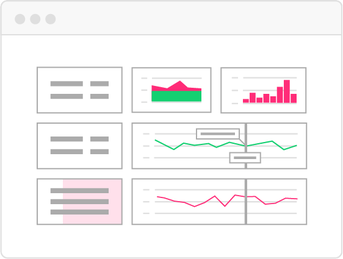
Synchronized Dashboards
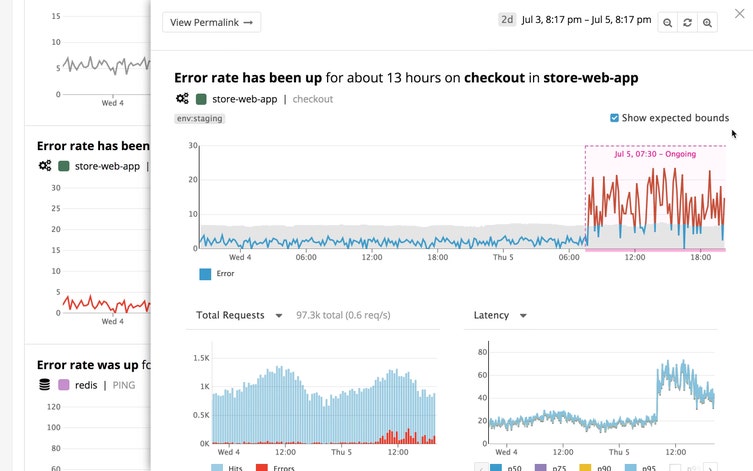
Track incidents across metrics with a common tagging structure.
Watchdog
Detect performance issues using machine learning.
Thousands of Customers Love & Trust the Datadog Platform
PHP APM Resources
Learn about PHP monitoring tools and best practices.