Debugging Java With Datadog | Datadog

Debug Java Applications Faster

Detect, diagnose, and resolve Java issues impacting end users in seconds. Seamlessly correlate distributed traces with metrics, logs, browser sessions, code profiles, synthetics, and network performance data.

A unified monitoring platform provides full visibility into the health and performance of each layer of your environment at a glance. Datadog allows you to customize this insight to your stack by collecting and correlating data from more than 800 vendor-backed technologies, all in a single pane of glass. Easily monitor your underlying infrastructure, supporting services, applications alongside security data in one centralized monitoring platform.


Simplify Complexity with End-to-End Visibility

  • Monitor all aspects of your application architecture from the user interaction to back-end storage - in a single platform
  • Easily identify bottlenecks, errors, heavy traffic issues, slow-running queries, and more with end-to-end application tracing, latency breakdowns, continuous profiling, and real user monitoring
  • Automatically collect, monitor, and visualize high-granularity data and custom metrics in real time, including availability, response times, reliability, error rates, and throughput

Debug Java Issues Faster

  • Identify critical issues quickly with real-time service maps, AI-powered synthetic monitors, and alerts on latency, exceptions, code-level errors, log issues, and more
  • Resolve detected Java problems faster with distributed request traces, logs, and infrastructure metrics all within one platform
  • Test hypotheses in seconds by overlaying application events onto time-synchronized metric graphs

Optimize Java Performance

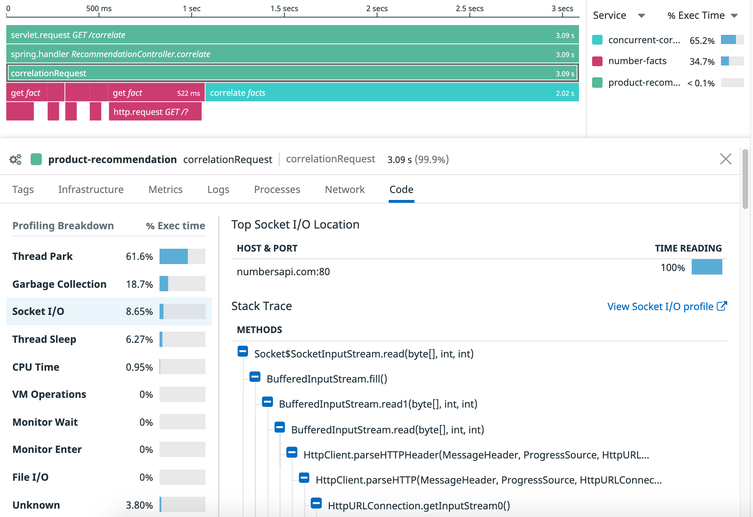
  • Detect the most resource-consuming methods or classes in your Java applications in seconds with a lightweight, next-generation profiler that’s easy-to-use and always-on
  • Determine the root cause of code issues with a breakdown of time spent by method on CPU, garbage collection, lock contention, and I/O; improve CPU utilization, memory allocation, and user latency
  • Surface runtime performance problems such as deadlocked threads, inefficient garbage collection, and memory leaks
apm/gif-3-code-level-visibility

Receive Alerts Only for the Issues that Matter and Eliminate False-Positives

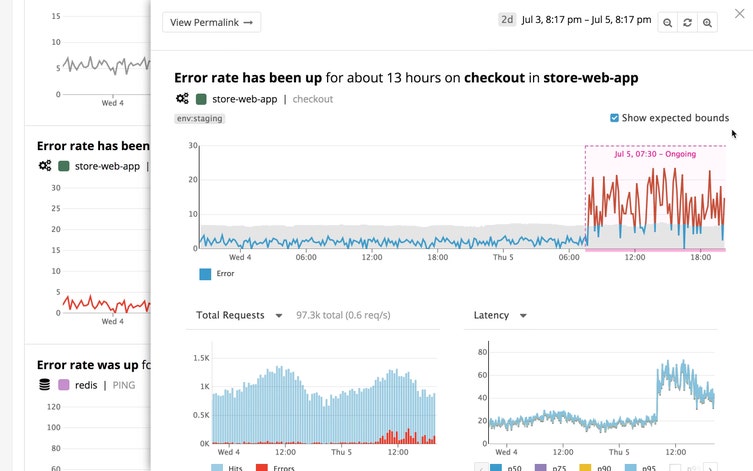
  • Set up recommended alerts with 1 click for anomalies and outliers that account for daily, weekly, and seasonal fluctuations
  • Proactively prevent outages and errors in the future by alerting on metric forecasts
  • Combine alerts into composite alerts for greater granularity and stronger signal to reduce the noise
  • Automatically detect unanticipated outliers, anomalies, and errors with Watchdog
products/alerts/watchdog-machine-learning-alerts

Spend Less Time Scaling and Maintaining Your Tools

  • Save time scaling and maintaining your open source tools as complexity grows within your stack
  • Automatically instrument your applications for popular Java frameworks such as Play, Spring, and Jetty
  • Efficiently analyze issues from any perspective with automated tagging integrated throughout the entire platform

The Essential Monitoring and Security Platform for the Cloud Age

Datadog brings together end-to-end traces, metrics, and logs to make your applications, infrastructure, and third-party services entirely observable.

Platform Diagram

Optimize your Systems with end-to-end cloud monitoring

See inside any stack, any app, at any scale, anywhere in one cloud observability platform
hostmap-infra-illustration.png

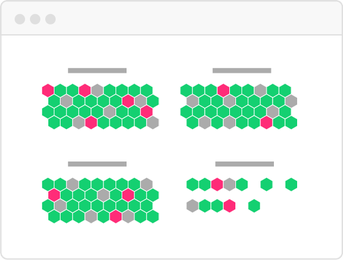
Host and Container Maps

Visualize the status of your servers or containers in a single view.
synchronized-dashboards-infra-illustration.png

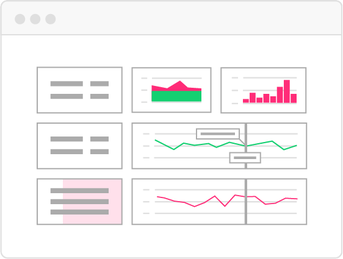
Synchronized Dashboards

Track incidents across metrics with a common tagging structure.
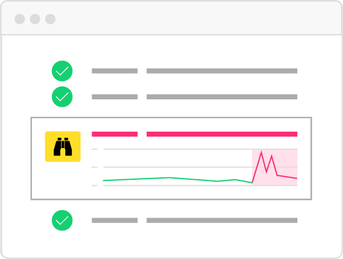
watchdog-apm-illustration.png

Watchdog

Detect performance issues using machine learning.

Loved & Trusted by Thousands

Washington Post logo 21st Century Fox Home Entertainment logo Peloton logo Samsung logo Comcast logo Nginx logo