Application Troubleshooting | Datadog

Application Troubleshooting

Quickly identify and troubleshoot application performance issues with Datadog.

When you’re troubleshooting applications, it’s critical to analyze all data in context to pinpoint issues quickly and accurately. Datadog’s unified monitoring platform allows you to seamlessly pivot between frontend and backend metrics, traces, logs, and more all in one pane of glass, so you can identify root causes faster.


Troubleshoot application performance in real time

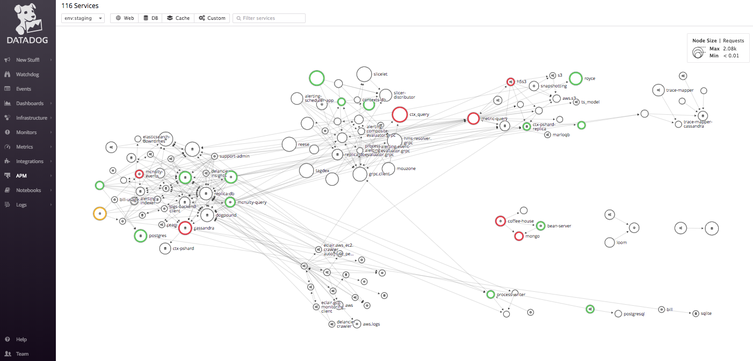
  • Map and cluster service interdependencies to identify an issue’s root cause and troubleshoot applications with the Service Map
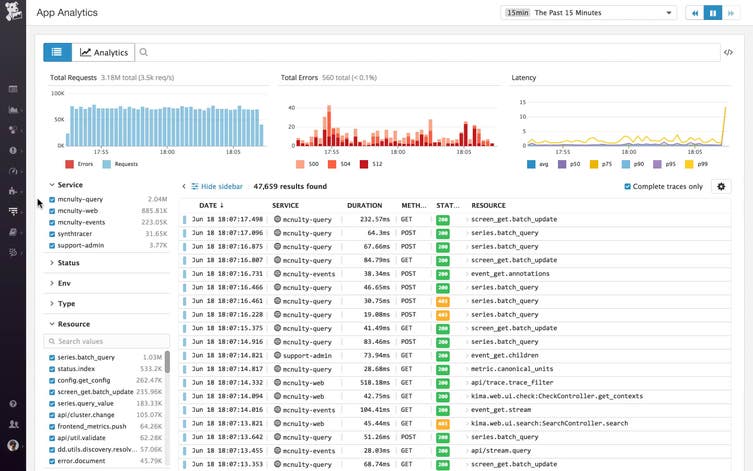
  • Filter traces for facets including error code, service, or custom tag with App Analytics and investigate latency issues at the code level with flame graphs
  • Collect data from popular frameworks including Java, Golang, Python, Ruby in minutes with a simple one-command install
Troubleshoot your applications by understanding service dependencies with the Service Map.

Analyze traces and frontend data to optimize user journeys

  • Synthetically test API endpoint requests to ensure application uptime and identify end users issues before they occur with browser tests
  • Visualize load times and filter UX data by facets like location to understand user journeys and troubleshoot frontend applications
  • Use App Analytics with infinite cardinality to cut and aggregate traces based on metadata to identify which users have the worst experience
  • Map dynamic network flows and track metrics such as traffic volume and TCP retransmits with Network Performance Monitoring
Troubleshoot your applications by filtering and analyzing distributed traces with App Analytics.

Accelerate application troubleshooting with full stack data

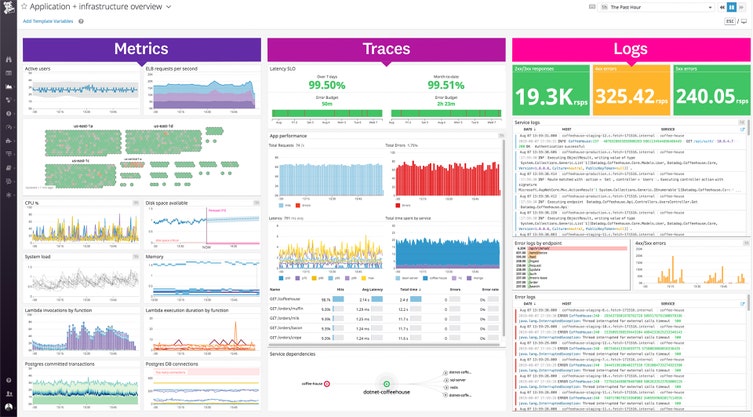
  • Speed up application troubleshooting and issue resolution by navigating between metrics, traces, logs and more in one unified platform
  • Reduce alert maintenance and fatigue with AI-powered and tag-based monitors that automatically enroll new hosts, containers, and other dynamic infrastructure
  • Track, visualize, and alert on your remaining error budget, burn rate, and other SLOs for your entire systems or specific services and applications
Troubleshoot your applications faster by unifiying metrics, traces, and logs.

The Essential Monitoring and Security Platform for the Cloud Age

Datadog brings together end-to-end traces, metrics, and logs to make your applications, infrastructure, and third-party services entirely observable.

Platform Diagram

Full stack application troubleshooting

Monitor and troubleshoot application performance issues rapidly.
watchdog-apm-illustration.png

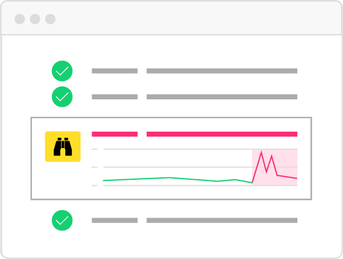
Watchdog

Automatically detect application performance issues without manual setup or configuration.
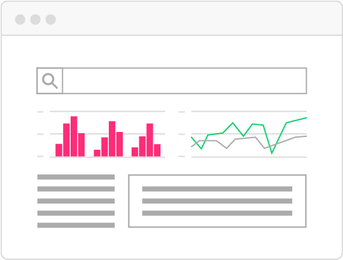
tracesearch-apm-illustrationv2.png

App Analytics

Search, filter, and analyze tack traces at infinite cardinality.
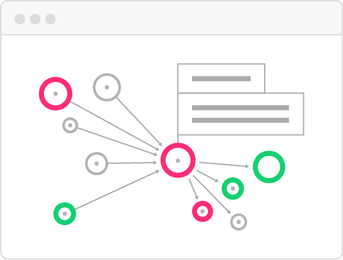
servicemap-apm-illustration.png

Service Map

Map applications and their supporting architecture in real time.

Loved & Trusted by Thousands

Washington Post logo 21st Century Fox Home Entertainment logo Peloton logo Samsung logo Comcast logo Nginx logo

Application Troubleshooting Resources

Learn about application troubleshooting features and success stories.

Datadog APM Starter Kit

Frontend Application Troubleshooting